Community Climate Action Strategy Community Engagement Summary
A draft report summarizing the results of community engagement phases, including workshops and surveys, regarding View Royal's climate action planning.
Community Climate Action Strategy
Community Engagement Summary
DRAFT - December 2021
Contents
- Appendix A.
- Engagement Summary
- Introduction
- Community Engagement Workshops
- Workshop One
- Workshop Two
- Community Surveys
- Introduction
- Survey #1 Preamble
- Survey #1 Results
- Survey #2 Preamble
- Survey #2 Results
Appendix A.
Engagement Summary
Introduction
Community engagement for the development of the View Royal Community Climate Action Strategy was conducted in two phases. The first involved workshops with community stakeholders, staff, and a few members of Council to inform the creation of the strategy. The second phase focused on broader community feedback, in the form of two community surveys, to provide additional confirmation on the direction of the CCAS. The following summary highlights the activities conducted in each phase and the outcomes that influenced the creation of the strategy.
While COVID-19 presented challenges to the community engagement the pivot to online workshops and surveys still allowed for fulsome participation among residents and the engagement process was still able to meet its objectives to provide education and increase awareness on climate action generally and the Community Climate Action Strategy specifically.
Other objectives of the engagement process were to communicate the scale of actions, both individual and community commitment required to meet the Town’s desired GHG emissions reduction target, to envision a low carbon future for View Royal, and to clearly articulate the co-benefits associated with climate action. Messages and workshop design ensured these themes were woven throughout the engagement process.
Community Engagement Workshops
On Oct 4 & 13th, View Royal community stakeholders gathered via Zoom over two evenings to discuss View Royal’s Community Climate Action Strategy. The workshops were facilitated by Community Energy Association (CEA) staff and featured in-depth discussion on the current sources of community emissions in View Royal, climate risks for the area, envisioning a low carbon and resilient future, and reviewing and prioritizing the “Big Moves” the actions local governments can take to reduce community Greenhouse Gas Emissions (GHGs).
Workshop participants and community stakeholders represented the following groups:
- Town of View Royal Councillors and staff
- Residents
- View Royal Climate Coalition
- Victoria Highland Games Society
- Island Health
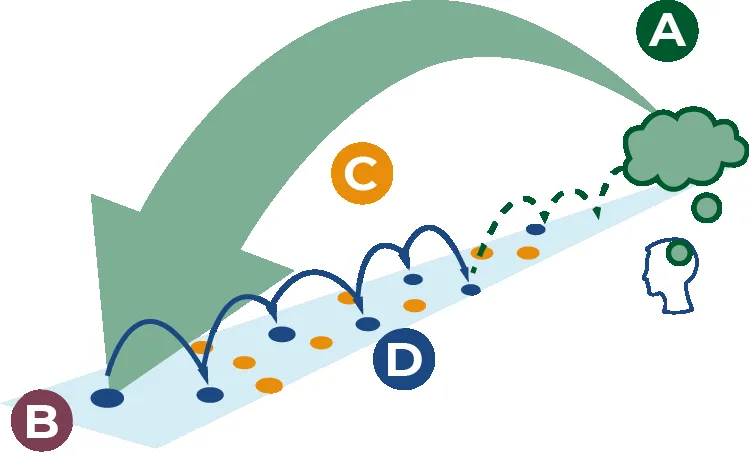
The workshops followed the “backcasting” approach, which asks participant to first envision a low carbon future and define success, before moving on to gathering their feedback to identify the current state of climate action in their community. In workshop #2 the focus in on creative solutions and prioritizing the necessary actions to achieve the vision.
Workshop participants were divided into three breakout groups and remained in the same group throughout. The breakout groups were;
- Transportation
- Buildings
- Waste & Other
Workshop One
Activity A – A Vision of the Future
In the first breakout session, participants were asked to describe their low carbon vision for the future for View Royal buildings, transportation/land use, and waste. The year 2040 was used in this exercise as it bridges the gap between 2030 which is the short-term target year and 2050 which is the long-term target year. Participants were told that their vision could be unimpeded by traditional constraints such as cost. Participants were encouraged to be bold with their ideas. Miro, an online white board, was used to capture the feedback from participants in each of the breakout sessions. The Miro boards can be seen in Figure ?, Figure ?, and Figure ?.
Figure ? – A Vision of the Future for Transportation & Land Use
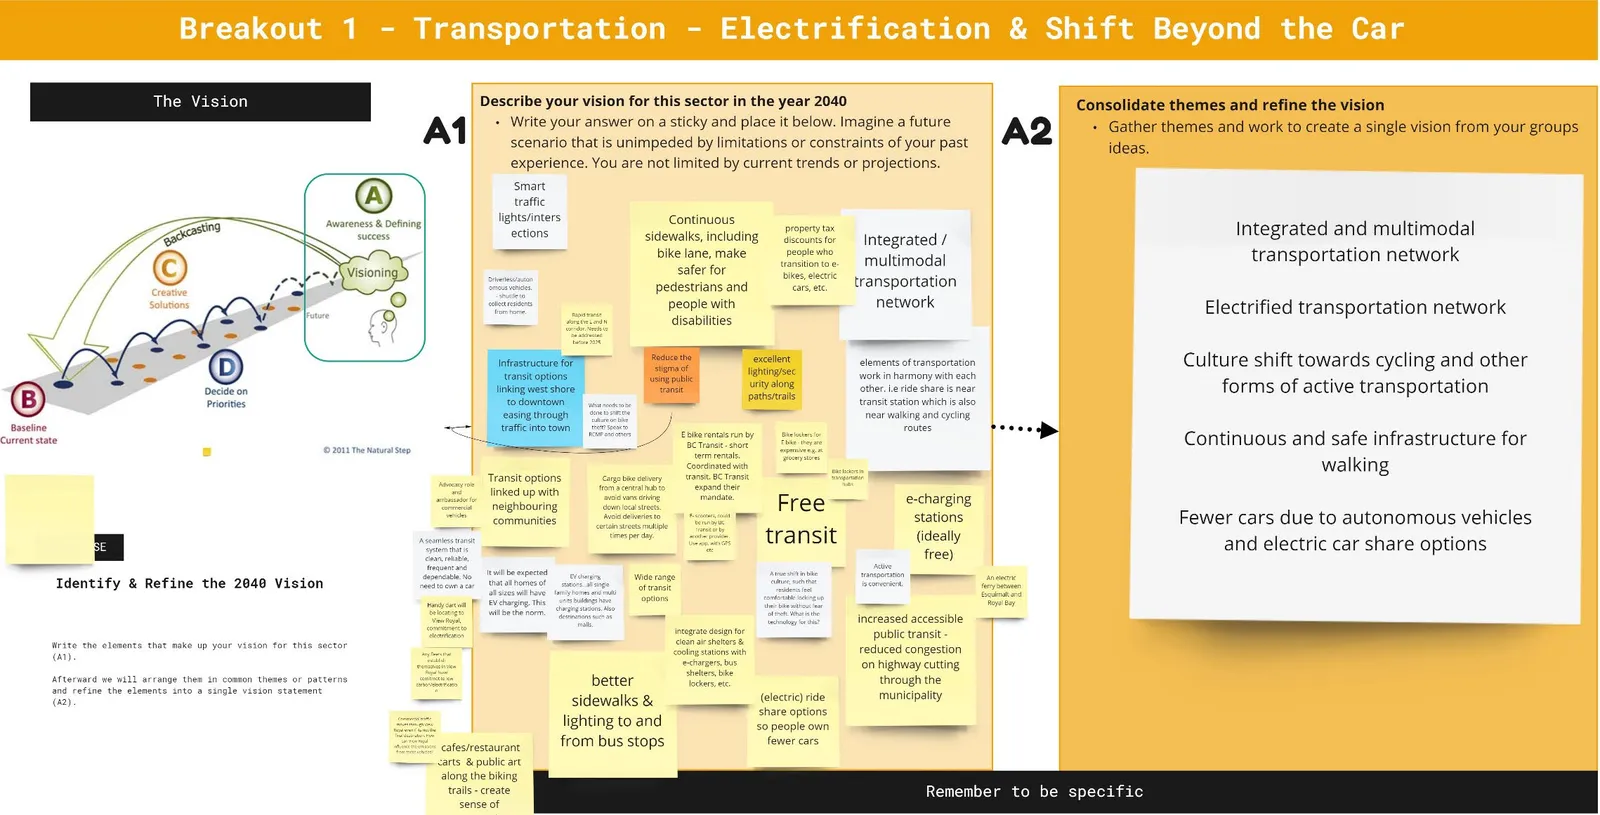
Consolidated themes and refined vision:
- Integrated and multimodal transportation network
- Electrified transportation network
- Culture shift towards cycling and other forms of active transportation
- Continuous and safe infrastructure for walking
- Fewer cars due to autonomous vehicles and electric car share options
Figure ? – A Vision of the Future for Buildings
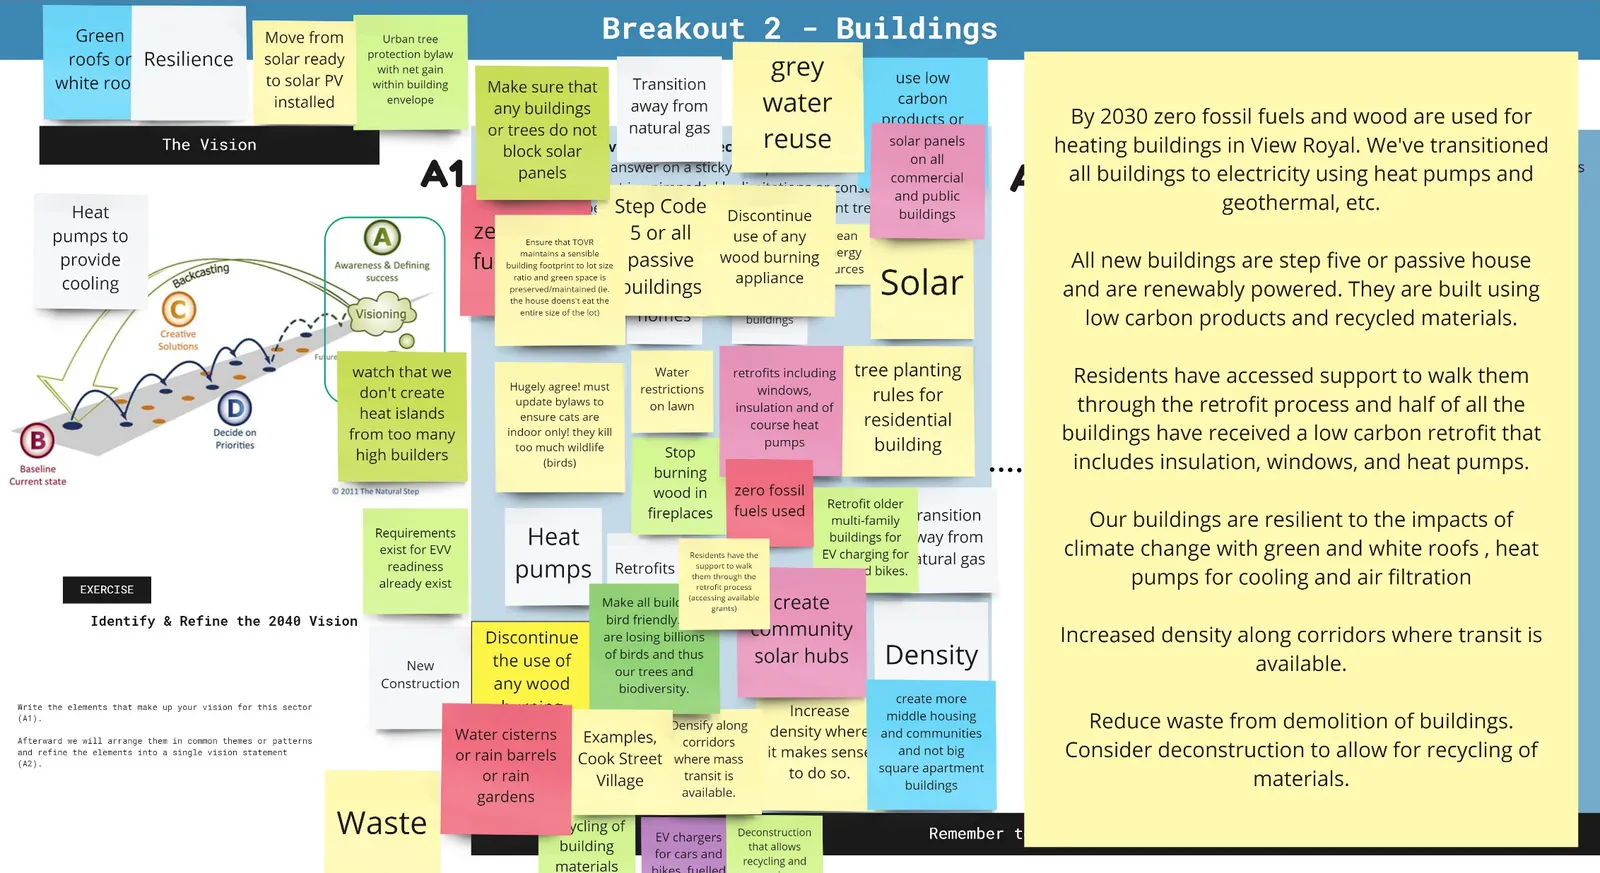
Vision Statement: By 2030 zero fossil fuels and wood are used for heating buildings in View Royal. We've transitioned all buildings to electricity using heat pumps and geothermal, etc.
All new buildings are step five or passive house and are renewably powered. They are built using low carbon products and recycled materials.
Residents have accessed support to walk them through the retrofit process and half of all the buildings have received a low carbon retrofit that includes insulation, windows, and heat pumps.
Our buildings are resilient to the impacts of climate change with green and white roofs, heat pumps for cooling and air filtration.
Increased density along corridors where transit is available.
Reduce waste from demolition of buildings. Consider deconstruction to allow for recycling of materials.
Figure ? – A Vision of the Future for Waste and Other Sectors
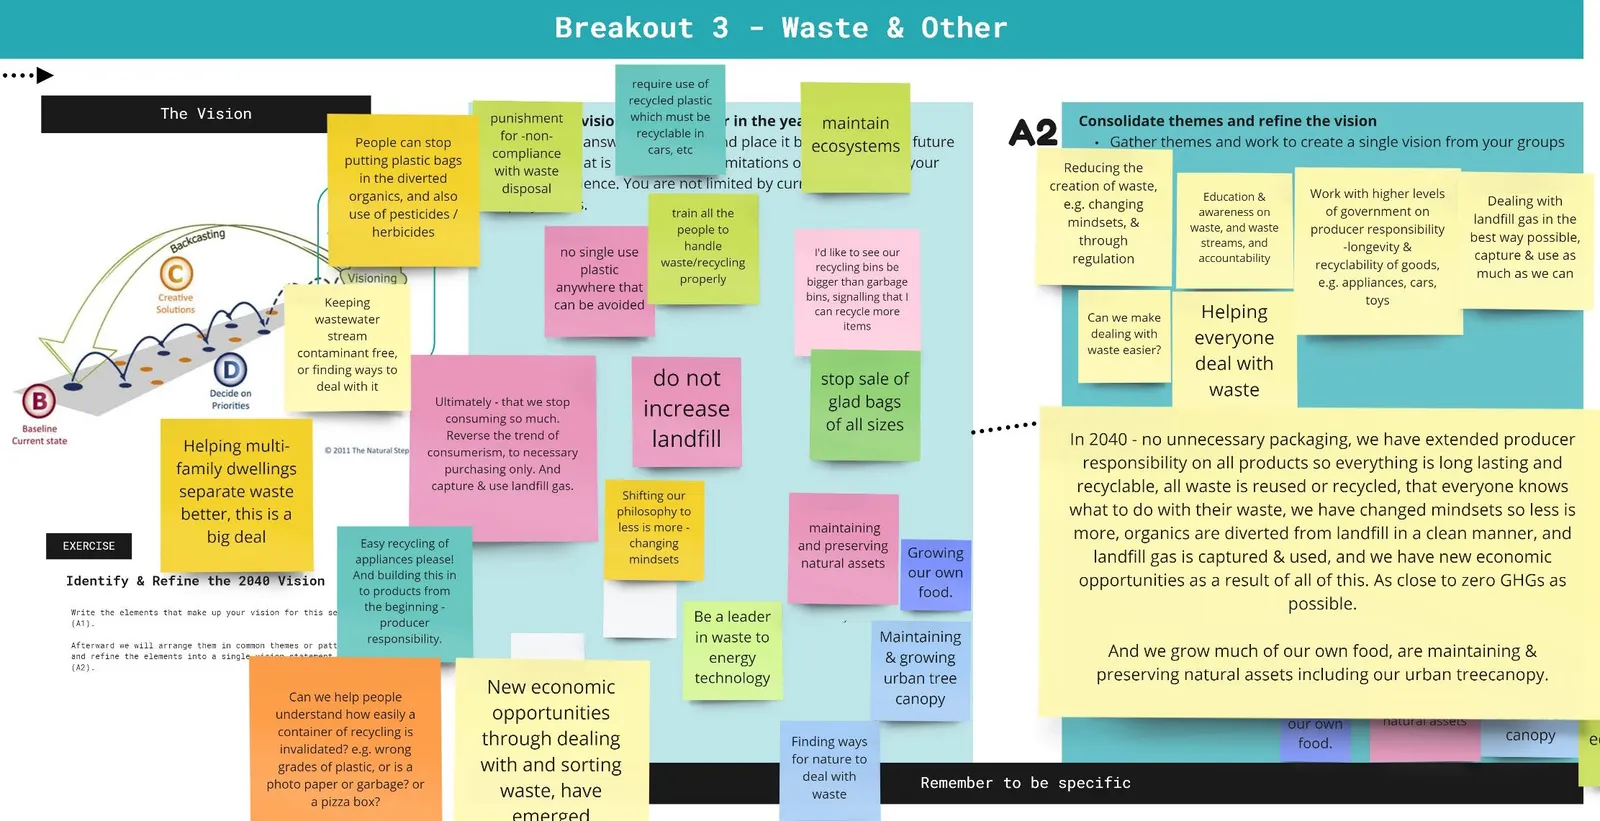
Vision Statement: In 2040 - no unnecessary packaging, we have extended producer responsibility on all products so everything is long lasting and recyclable, all waste is reused or recycled, that everyone knows what to do with their waste, we have changed mindsets so less is more, organics are diverted from landfill in a clean manner, and landfill gas is captured & used, and we have new economic opportunities as a result of all of this. As close to zero GHGs as possible.
And we grow much of our own food, are maintaining & preserving natural assets including our urban tree canopy.
Activity B – The Current State
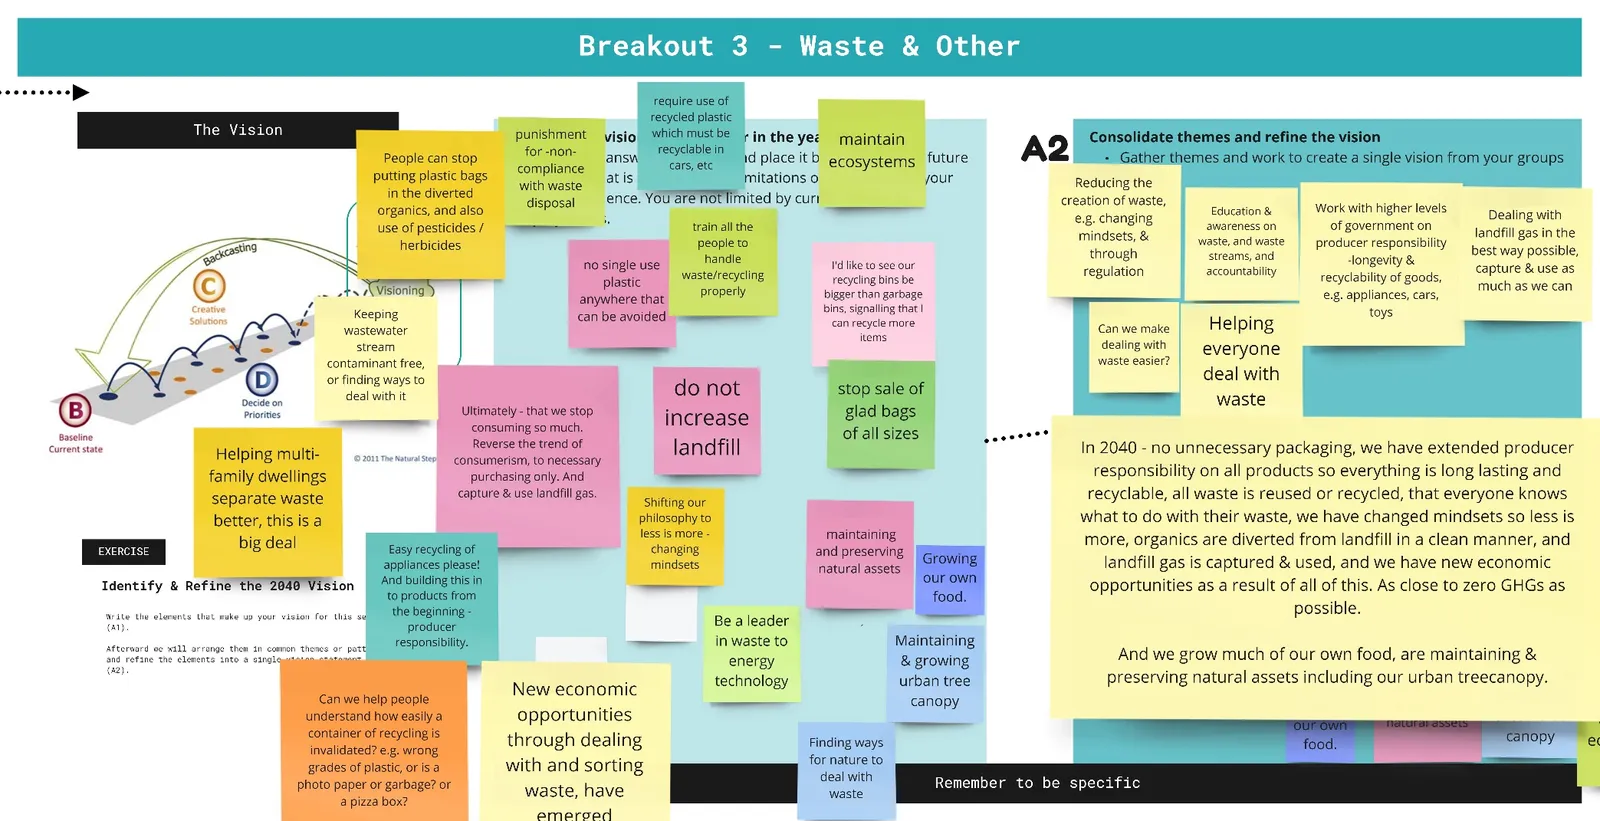
In the second breakout session, participants were asked to describe the current state of Buildings, Transportation & Land Use, and Waste & Other for View Royal. The Miro boards can be seen in Figure ?, Figure ?, and Figure ?.
Figure ? - The Current State of Transportation & Land Use
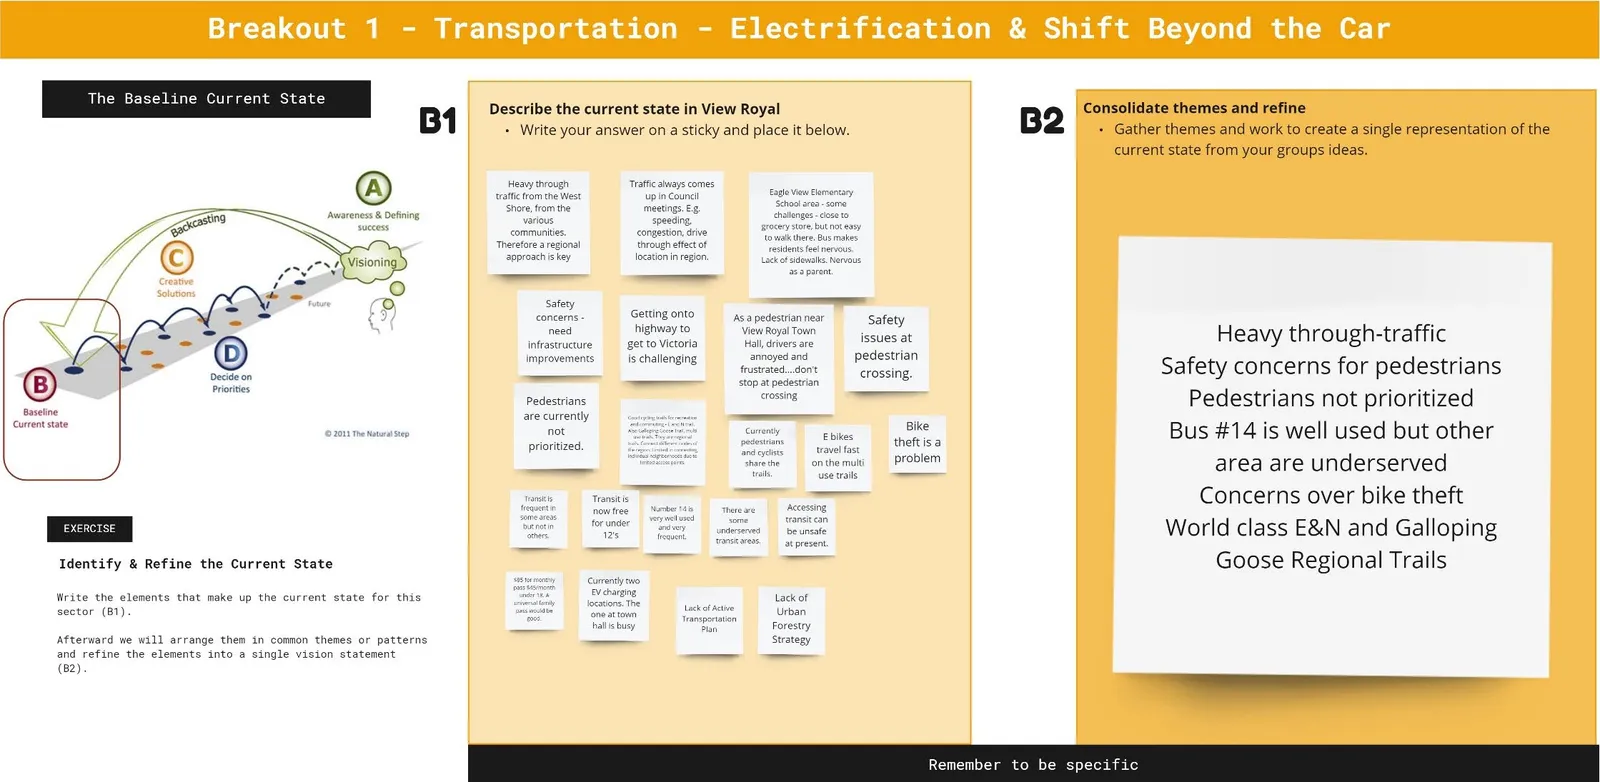
Consolidated themes and refine:
- Heavy through-traffic
- Safety concerns for pedestrians
- Pedestrians not prioritized
- Bus #14 is well used but other area are underserved
- Concerns over bike theft
- World class E&N and Galloping Goose Regional Trails
Figure ? – The Current State of Buildings
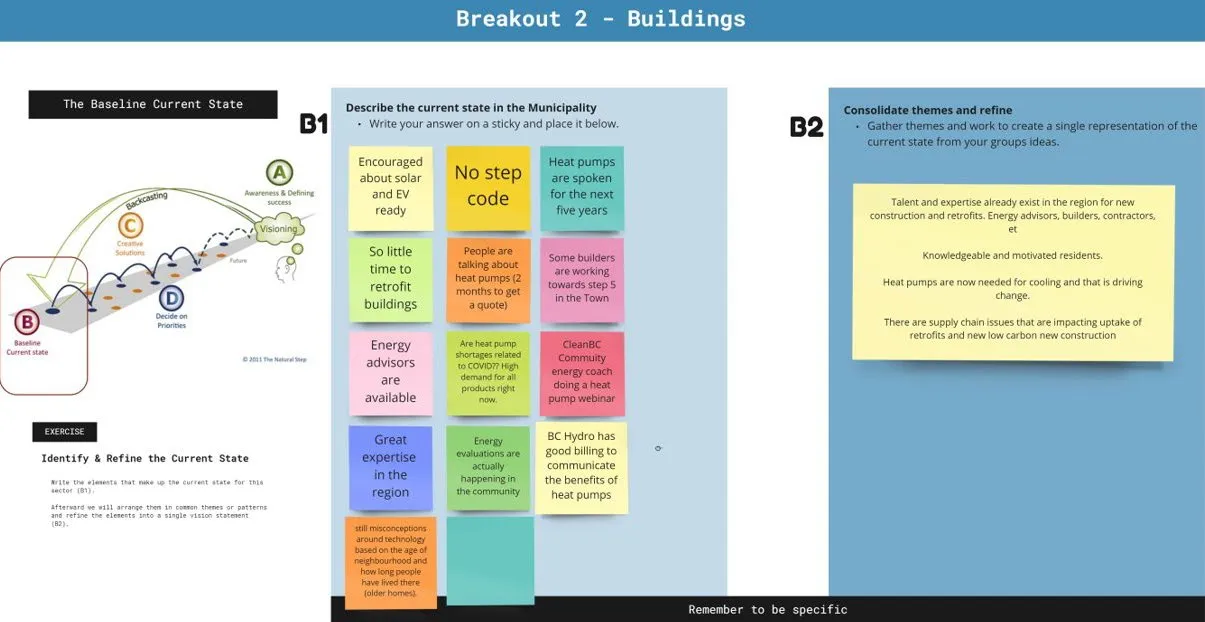
Consolidated themes and refine:
- Talent and expertise already exist in the region for new construction and retrofits. Energy advisors, builders, contractors, et
- Knowledgeable and motivated residents.
- Heat pumps are now needed for cooling and that is driving change.
- There are supply chain issues that are impacting uptake of retrofits and new low carbon new construction
Figure ? – The Current State of Waste & Other Sectors
Workshop Two
Activities C and D – Identifying and Prioritizing Creative Solutions
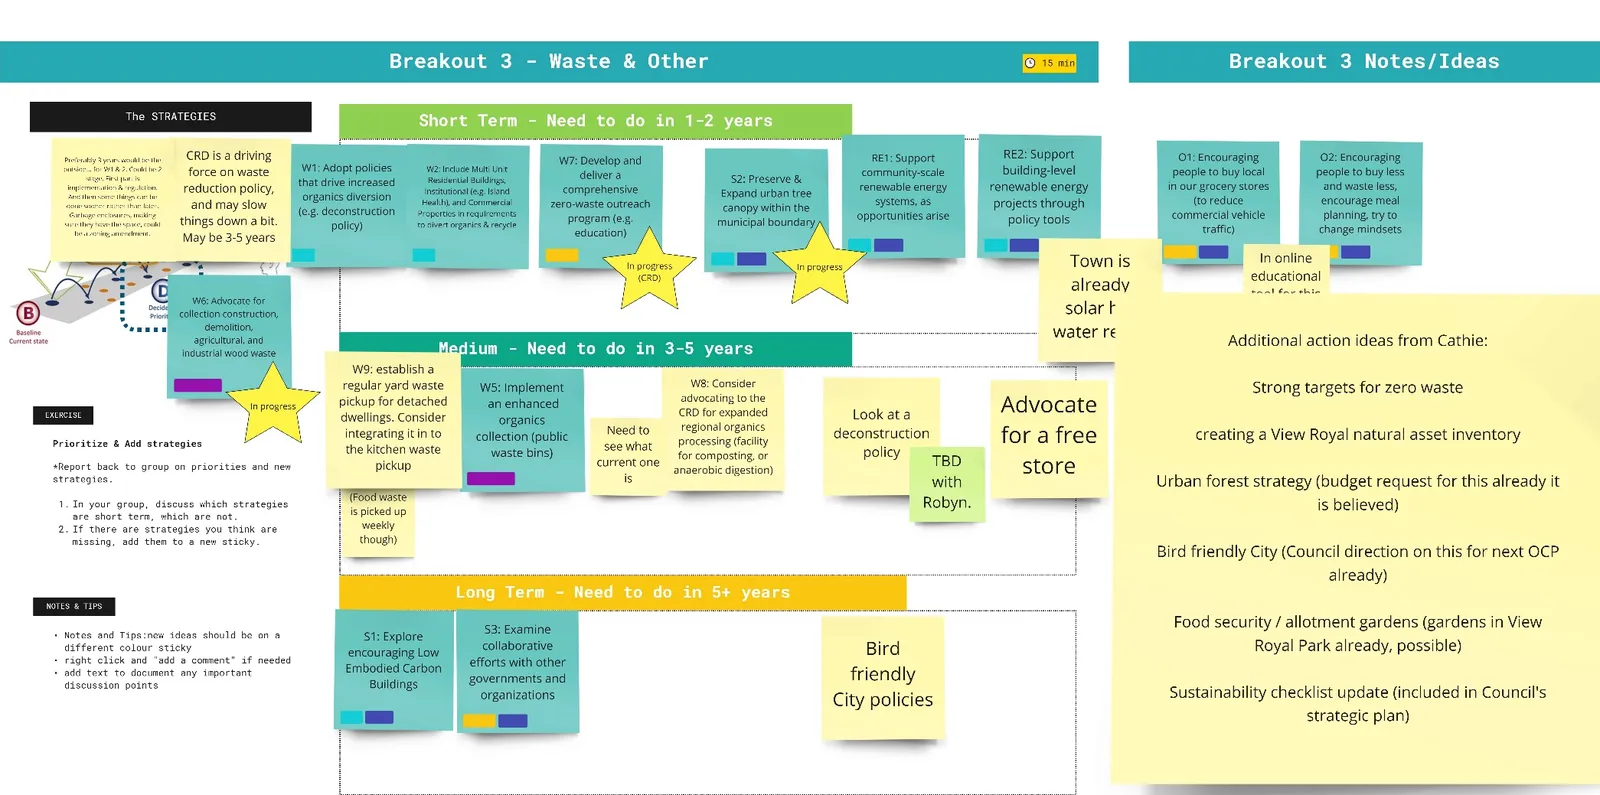
In the third breakout session, participants were asked to consider a number of creative solutions provided by CEA and identify additional ones. These creative solutions, or strategies, were then prioritized according to possible implementation timelines. Strategies were prioritized in the following way;
- Short-term implementation (1 - 2 years)
- Medium-term implementation (3 – 5 years)
- Long-term implementation (5+ years)
Figure ?, Figure ?, and Figure ? show the prioritization of the Buildings, Transportation, and Waste & Other strategies respectively.
Figure ? – Prioritization of Transportation & Land Use Strategies
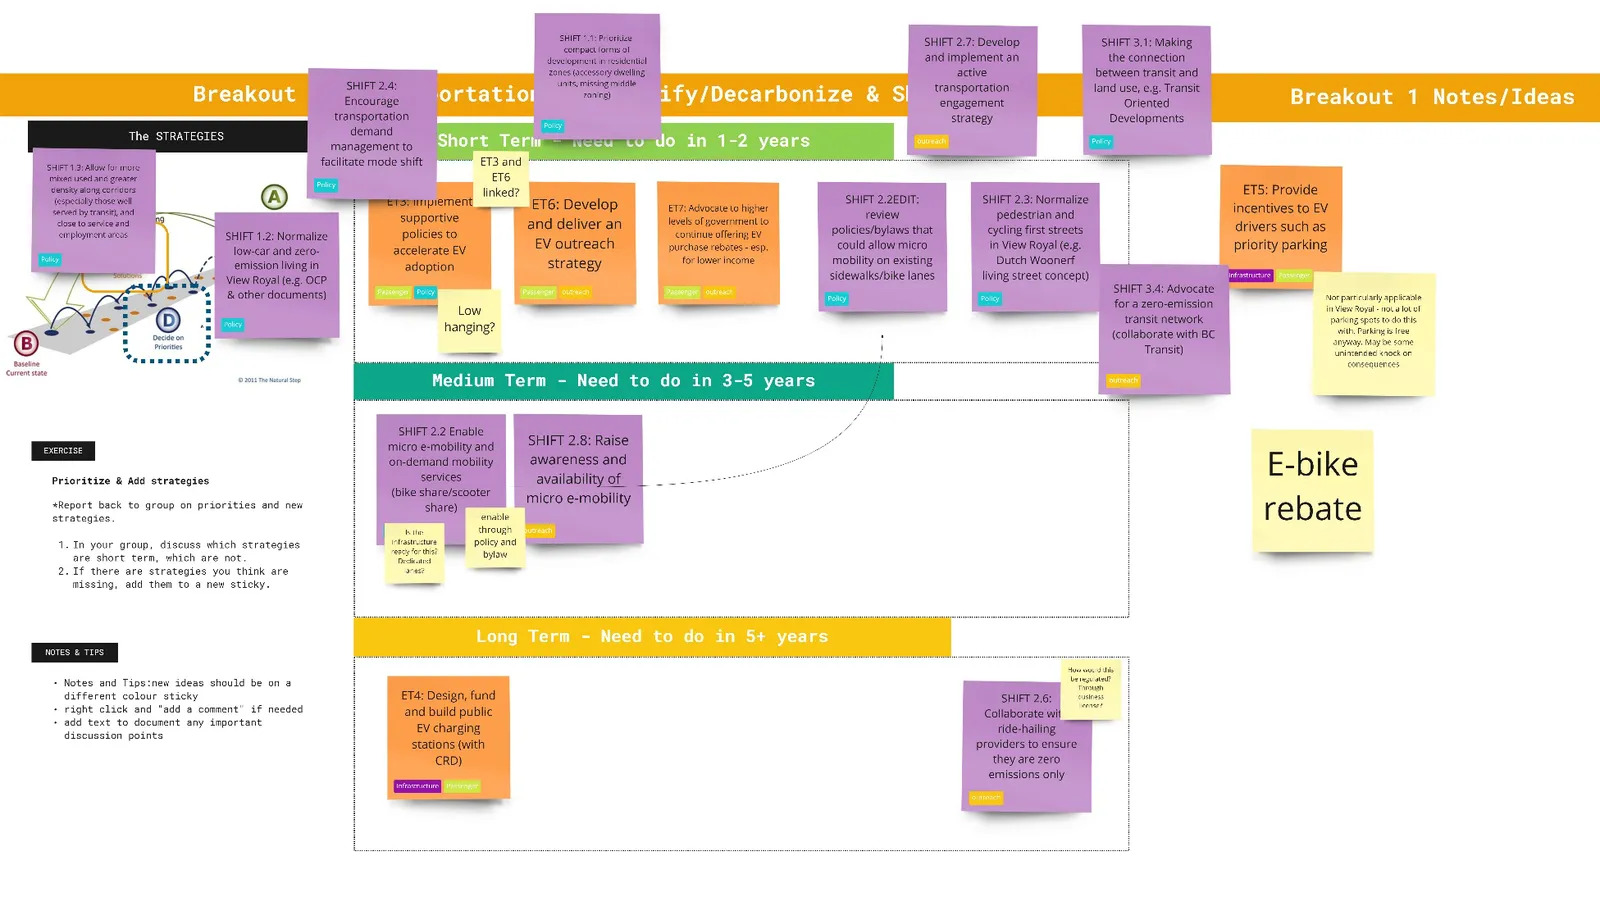
Figure ? – Prioritization of Buildings
Deep Dive on Priority Strategies
In the final breakout session of workshop 2, participants were asked to select one or two of the priority strategies and do a deep dive in terms of co-benefits, local leverage points, barriers/challenges, catalysts/potential for collaboration, equity and next steps. The Miro boards for this exercise can be seen in Figure ?, Figure ?, and Figure ?.
Figure 1 – Deep Dive on Strategies for Transportation & Land Use
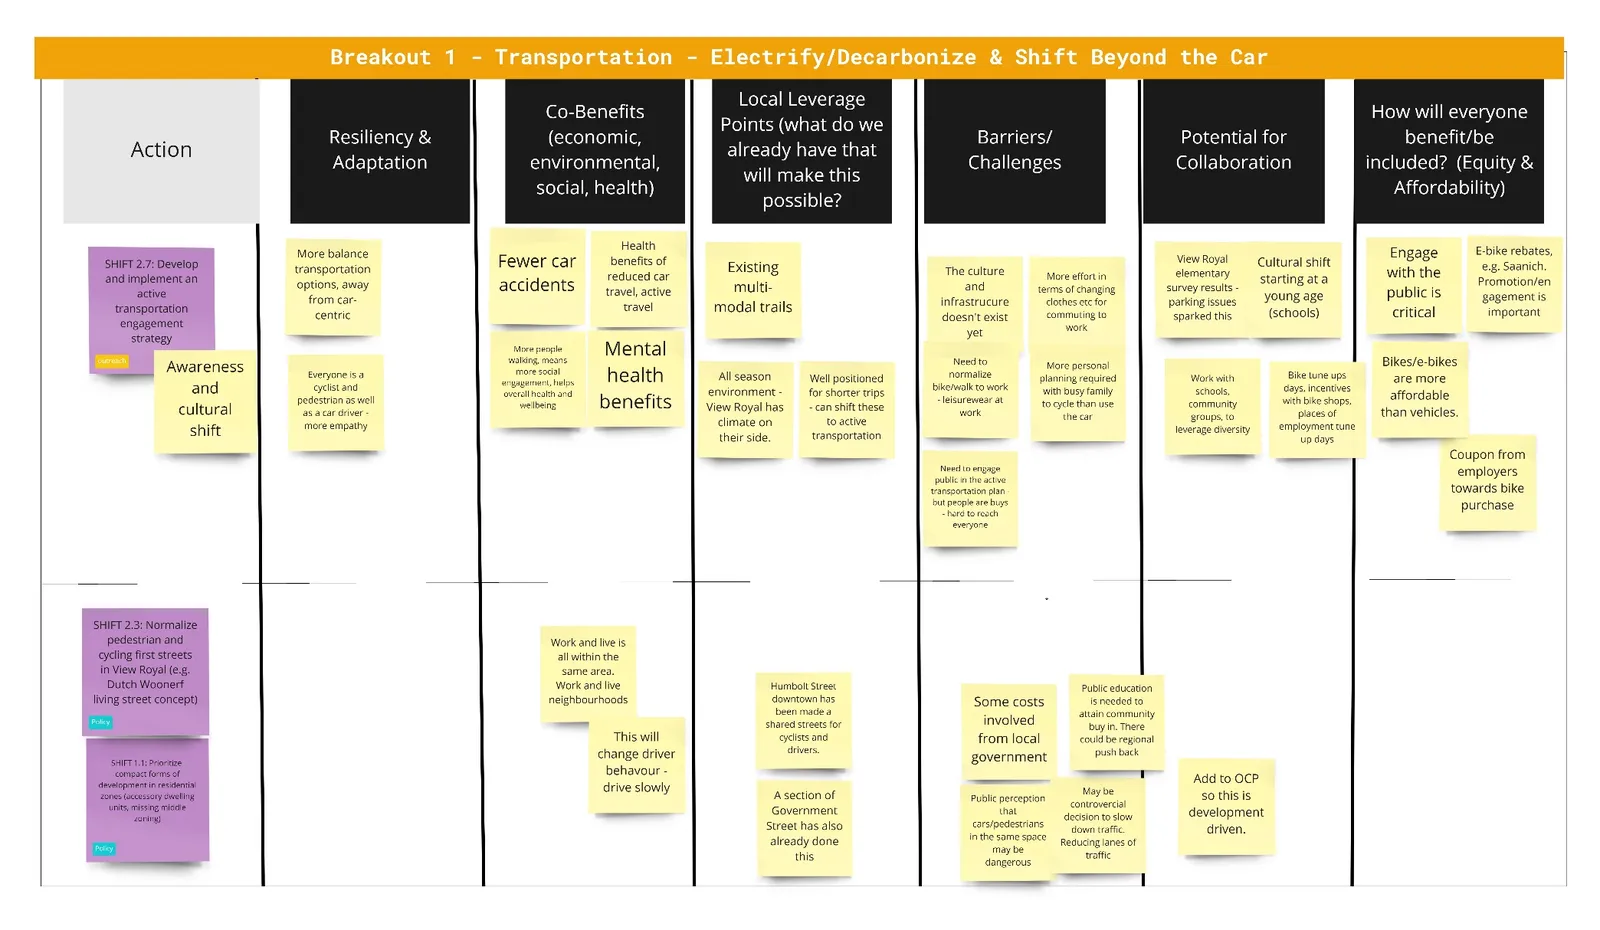
Figure ? – Deep Dive on Strategies for Buildings
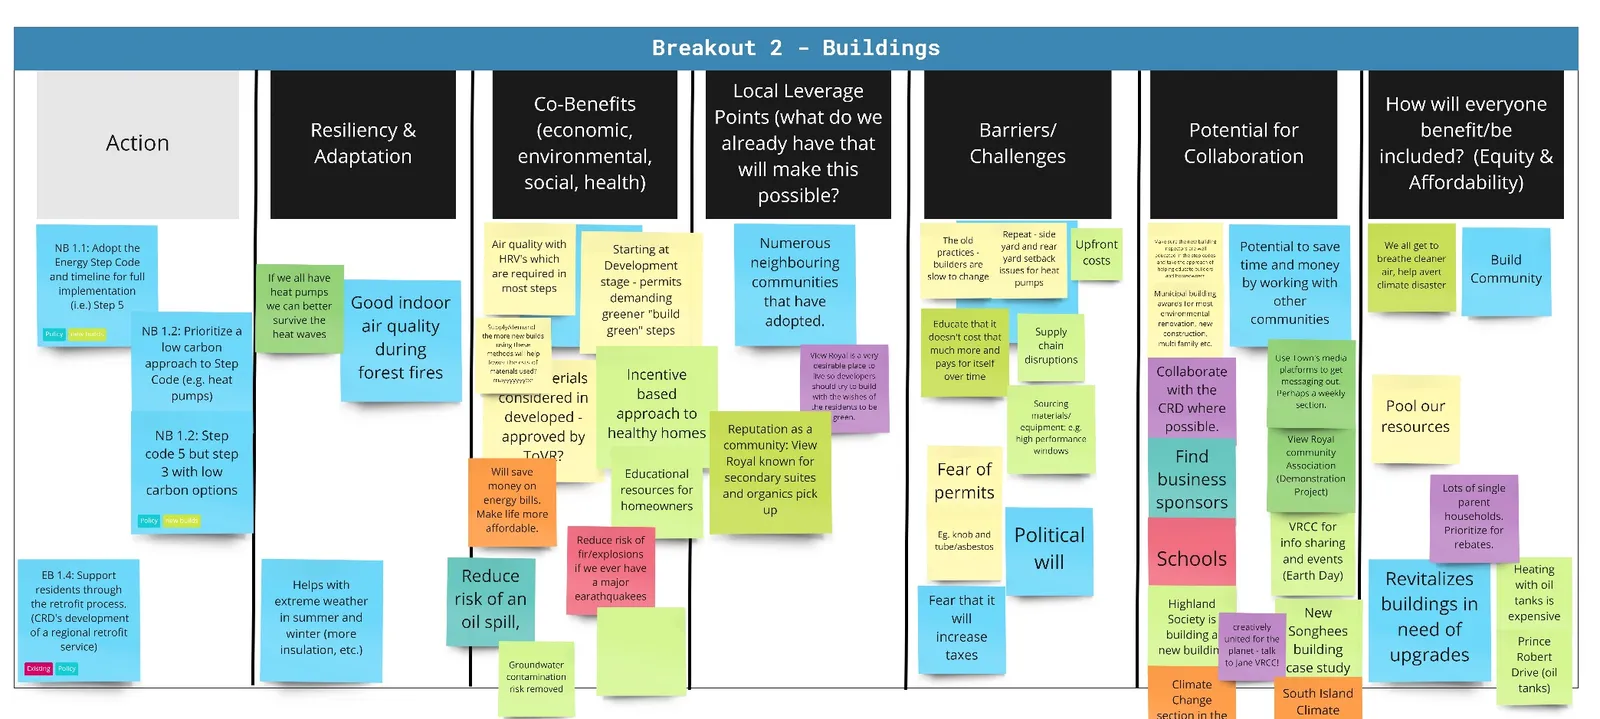
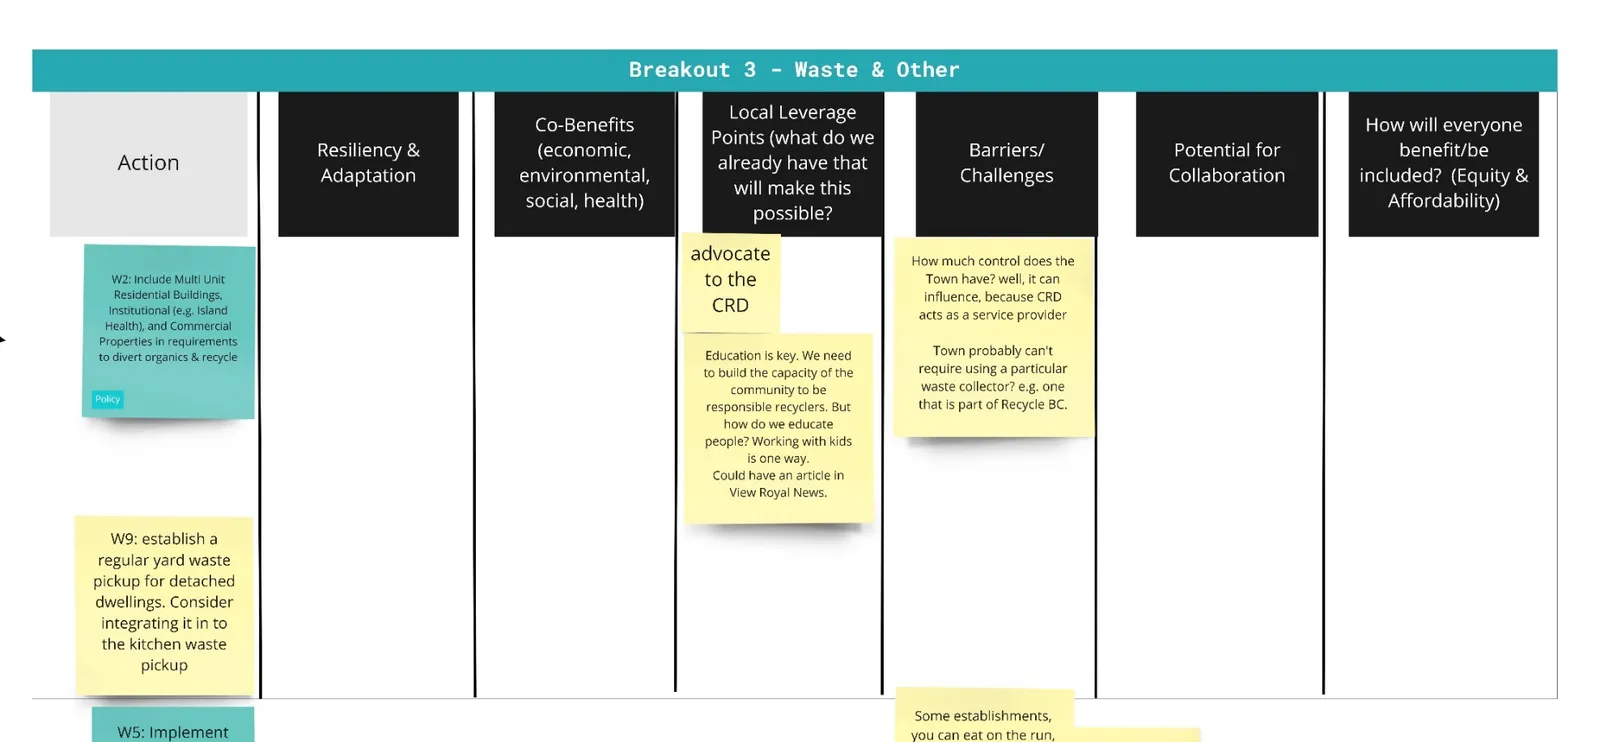
Figure ? – Deep Dive on Strategies for Waste & Other
Community Surveys
Introduction
The second part of the Community Engagement Strategy for the CCAS was comprised of two community surveys. The surveys were open for public comment in October and November. Surveys were advertised to residents through social media, the Town’s website, and to workshop participants. Using simple design and clear questions, the surveys gathered input on high-level areas of action, proposed targets and next step priorities.
- Survey #1 had just under 100 respondents
- Survey #2 has 54 respondents.
Leading engagement and communication scientists at the UK-based Climate Outreach have collected a tremendous amount of data (including data from Canada) confirming that we can’t science-talk our way into sustained public action on climate change. Indeed, the public has a right to know and understand the science, the surveys were used to bolster View Royal residents understanding of the plan’s eventual low carbon solutions, through the lens of their existing values and understanding of their community.
The community surveys served the dual purpose of informing the community of this process and its importance while also getting a better understanding of values and existing mental models related to climate change. Having this information will prepare the Town to effectively communicate to residents when the plan is adopted.
Survey #1 Preamble
The Town of View Royal is one of nearly 1,500 communities around the world to have declared a climate emergency. Now, more than ever before, our community needs bold climate action that reflects the gravity of this declaration and appropriately addresses the crisis of global climate change. That is why we are doing a Community Climate Action Strategy (CCAS). The CCAS will be our pathway to how we can reduce our contribution to the GHG emissions that cause climate change. For it to be successful, it must also reflect our values, our needs and our community to build social, economic and environmental resilience.
As we build this plan, we want to make sure residents have a chance to tell us what matters to them what they need to make low carbon decisions the easy decisions. This survey is intended to answer the questions:
- What are View Royal residents thinking and feeling about the changing climate?
- How much do View Royal residents already know about climate change and how to reduce GHG emissions?
- What opportunities are there for the Town to increase residents’ awareness and understanding of how climate change will impact our community?
When we analyse the results of this survey, we hope to get a better idea of how to ensure residents have information they need to make decisions about how to save energy, emissions and money. We also intend to ensure that as the CCAS is created, it reflects the priorities of our residents. This is the first of two surveys in the CCAS process. The second survey will be released in November 2021 and will be your opportunity to tell us specifically which actions we should prioritize in the CCAS.
Why are we collecting personal information like neighbourhood and age? One of our goals as we begin engagement on the CCAS is to collect feedback from a diverse sample of our population. Having this information helps us see if we are hearing from as many residents as possible.
Survey #1 Results
Overall Sentiments on Climate Change
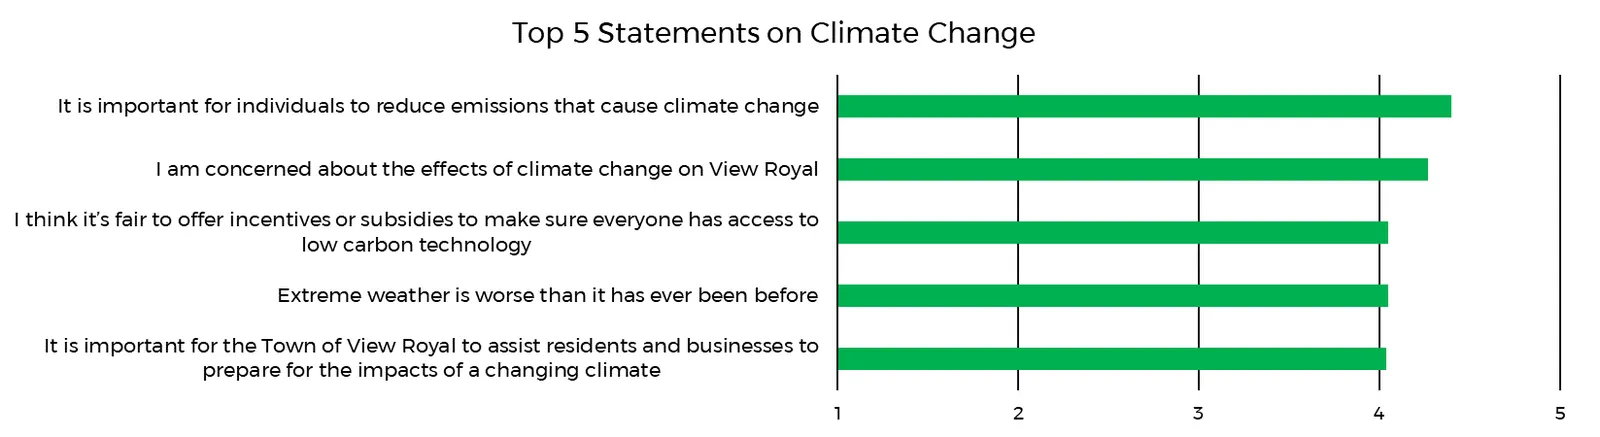
Survey respondents were asked to rate their level of agreement on 13 statements related to climate change from strongly disagree (1) to strongly agree (5). Results shown below are weighted averages of the top 5 statements.
Results indicate a high level of concern on the effects of climate change on View Royal, and a necessity for shared responsibility between individual residents and the Town to both mitigate and adapt to climate change.
How Climate Has Already Impacted View Royal
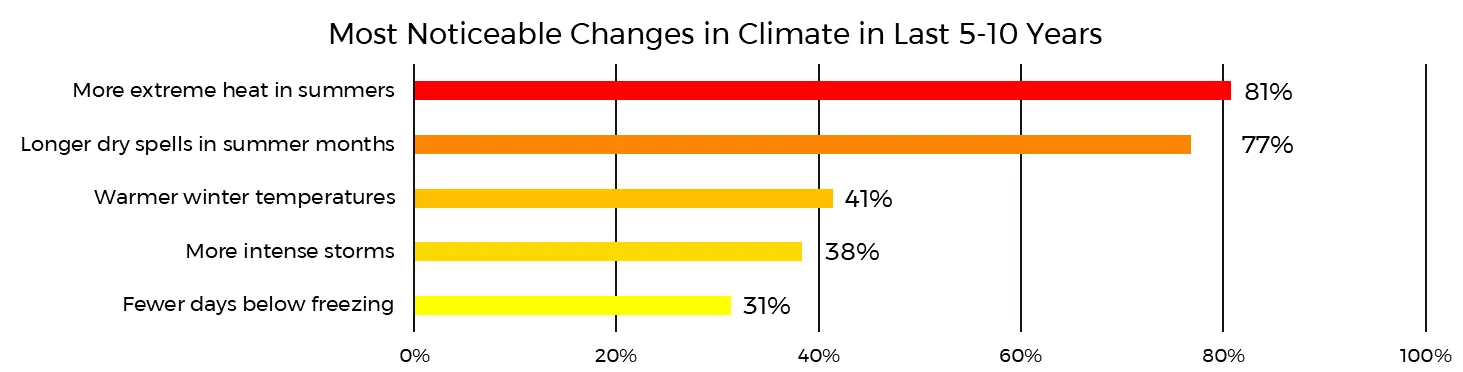
Next, respondents were asked to identify ways in which climate has already changed in View Royal over the past 5-10 years. Out of 10 choices, the top 5 were identified below as the percentage of people who agreed with the specific change in climate.
The top two changes in climate are summer-related, with more extreme heat and longer dry spells being noticed by 81% and 77% of respondents, respectively. These results may have been influenced by the “heat dome” phenomenon this past June/July. There is a significant drop off in noticeability for the next three changes in climate, which are predominantly winter-related, with warmer and stormier winter conditions being noticed by 41% and 38% of respondents, respectively.
Actions to Reduce Individual Carbon Footprints
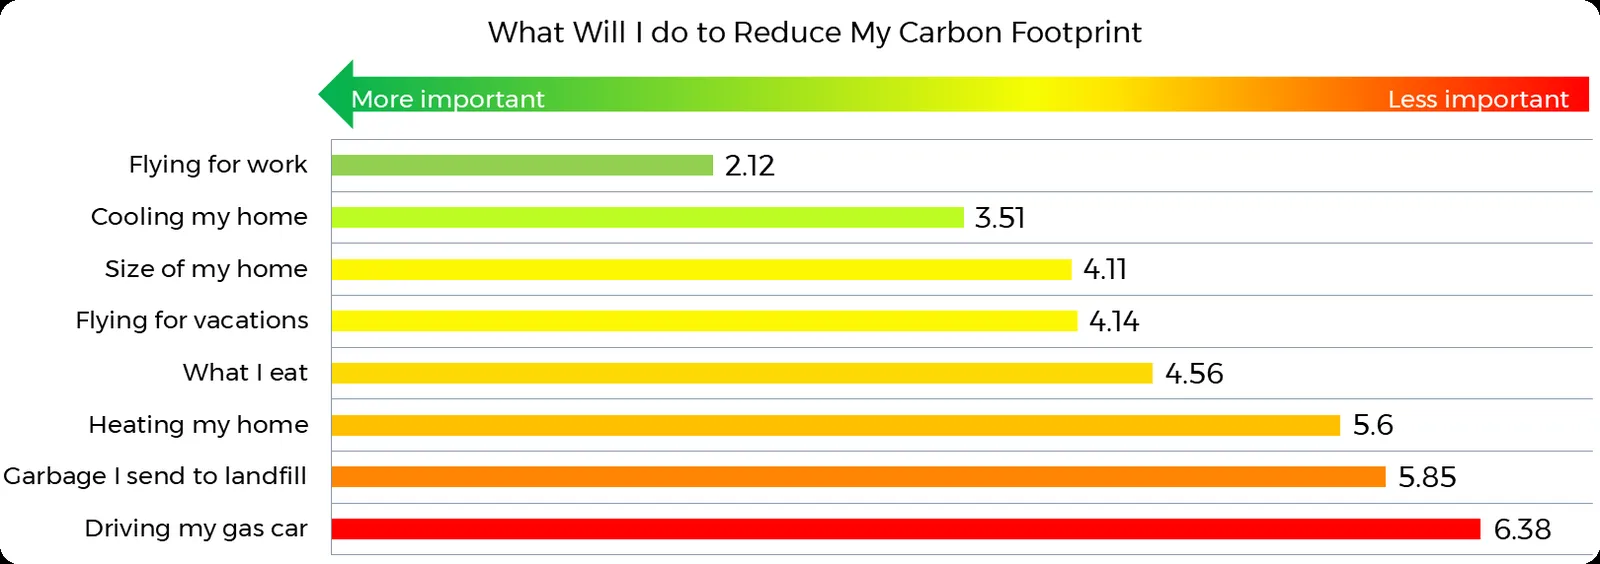
In the next question, respondents were asked to rank 8 actions that they as individuals would take to reduce their carbon footprint, with 1 being the most important, and 8 being the least important. The graph below shows these results, ranked from most important to least important.
Reducing the need to fly for work was seen as the most likely action to be implemented, at a rating of 2.12. This is likely a result of the pandemic highlighting the ability to interact remotely and not in person. Reducing flying for vacations on the other hand, was only seen as moderately likely, at a rating of 4.14. Interestingly, home cooling was seen as more likely to be done (3.51) vs. home heating (5.6). Given that home cooling is through electricity-based technologies such as air conditioners and heat pumps, vs. home heating which is more likely to use natural gas or other fossil fuels, it highlights the importance of advocating for heat pumps through incentives and education. Driving a gas car was seen as the least likely action to be done at 6.38, though drivers will be increasingly likely to purchase an electric vehicle as provincial and federal zero-emission vehicle mandates come into force.
Information Sources on Reducing Carbon Contribution
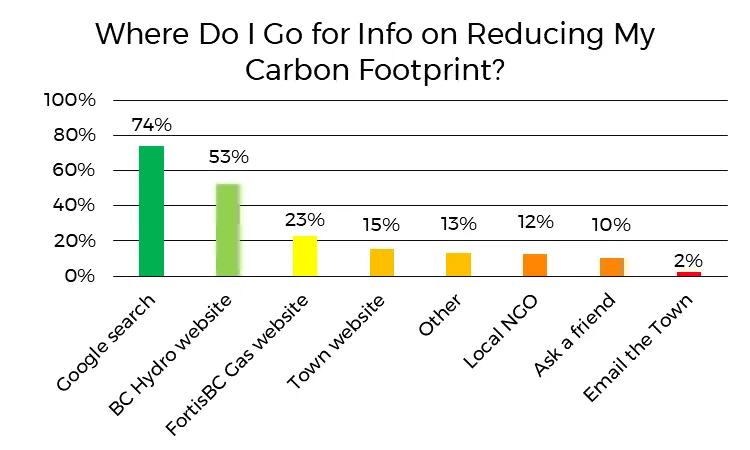
The last question asked respondents to identify which information sources they seek for information on how to reduce one’s carbon contribution. Respondents were allowed a maximum of 2 responses out of 8 choices.
As shown in Figure 4, Google searches were the most popular information source, used by 74% of respondents. The BC Hydro website followed next at 54%. Interestingly, the FortisBC website was only used by 23%, despite natural gas accounting for nearly 55% of residential emissions, and several rebates being available to reduce natural gas consumption. Combined with the low priority given to reducing home heating in Figure 3, a clear emphasis on improving education on reducing residential natural gas consumption for space heating will be important in View Royal’s CCAS.
Demographic Quickstats (Survey #1)
Average household: 2.2 adults, 1.2 children
| Household income | Age of Respondents | Where do I Live | |||
|---|---|---|---|---|---|
| < $60k | 5% | 18-25 | 1% | Atkins | 11% |
| $60k - $100k | 32% | 26-35 | 9% | Burnside | 8% |
| $100k - $200k | 52% | 36-45 | 31% | Craigflower | 4% |
| > $200k | 11% | 46-55 | 16% | Harbour | 23% |
| 56-65 | 18% | Helmcken | 37% | ||
| 66+ | 25% | Hospital | 7% | ||
| Thetis | 3% | ||||
| Wilfert | 5% | ||||
| Other | 2% |
Survey #2 Preamble
The Town of View Royal is one of nearly 1,500 communities around the world to have declared a climate emergency. Now, more than ever before, our community needs bold climate action that reflects the gravity of this declaration and appropriately addresses the crisis of global climate change. That is why we are doing a Community Climate Action Strategy (CCAS). The CCAS will be our pathway to reducing our contribution to the greenhouse gas (GHG) emissions that cause climate change.
The CCAS builds upon Town Royal’s achievements and climate action to date and will provide a roadmap to achieving deeper GHG emission reduction. Implementing the actions will also improve the Town’s resiliency to the effects of climate change. As we build this plan, we want to make sure residents have a chance to tell us what they think the Town’s priorities should be.
This is the second of two surveys in the CCAS process. The first survey helped us understand residents’ values around climate change. This survey will build upon those results, and give us a better idea of which actions are most important to residents. Why are we collecting personal information like neighbourhood and age? One of our goals as we gather feedback on the CCAS is to reach a diverse sample of the Town’s population. Having this information helps us see if we are hearing from as many residents as possible.
The deadline for survey completion is November 26.
View Royal Climate Facts
- In 2018, the community of View Royal emitted 45,507 tonnes of greenhouse gas emissions (CO2e).
- The current View Royal Official Community Plan has a target to reduce GHG emissions by 12% below 2007 levels by 2017, and 33% by 2030. The Town has also declared a climate emergency, with an intent to reach carbon neutrality by 2030.
- The Town’s emissions have decreased 5.6% between 2007 and 2018.
- Some of the main sources of our emissions are passenger vehicles (45%), buildings (35%) and organic waste (5%). Forests and parkland within the community actually help to reduce emissions (7%).
- The Government of Canada has set a target to reduce emissions 100% by 2050.
Survey #2 Results
Sentiments on Climate Change
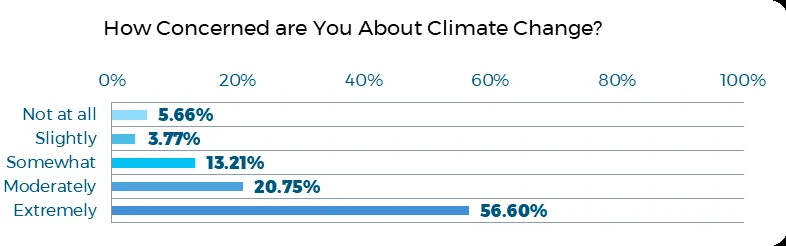
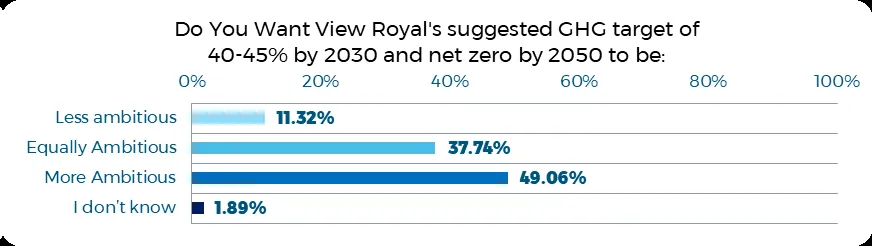
Overall, over half of the 53 respondents are extremely concerned about the effects of climate change, with over 90% at least somewhat concerned. This is reflected in the community’s GHG target ambition, where nearly half want View Royal’s GHG target to be more ambitious than the target recommended by the Federal Government and United Nations.
Support for Big Moves
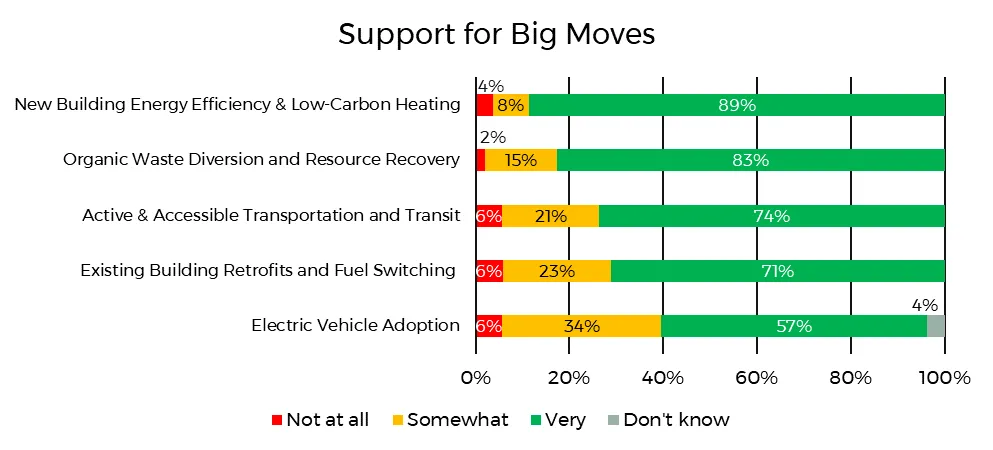
Support for the Big Moves was broad, with at least half of respondents being very supportive of the five Big Moves, and 94% being at least somewhat supportive. Support for Energy Efficient and Low-Carbon New Buildings garnered the highest level of support, with 89% of respondents being very supportive. This was followed closely by Organic Waste Diversion and Resource Recovery at 83%.
Support for Actions by Big Move
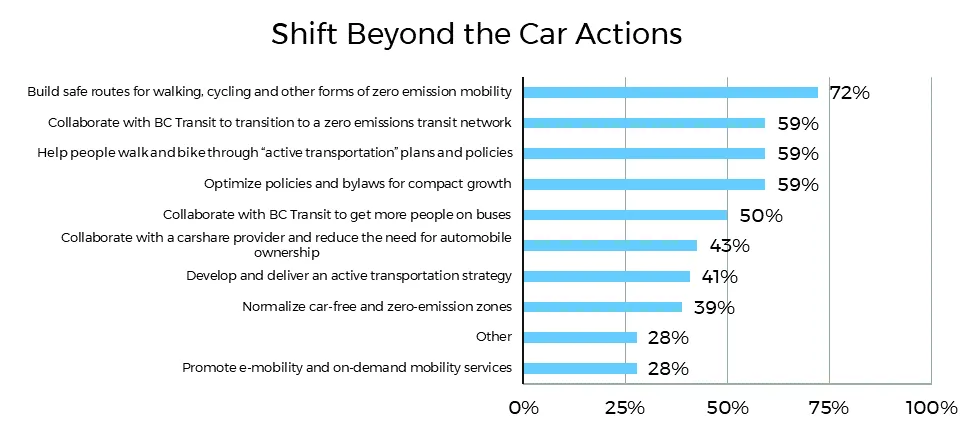
Shift Beyond the Car Actions
Support was highest for active transportation and transit infrastructure and policy, each receiving support by nearly 60% of respondents. However, only 41% of respondents supported developing and delivering an active transportation strategy, while the promotion of e-mobility and on-demand mobility scored even lower at 28%.
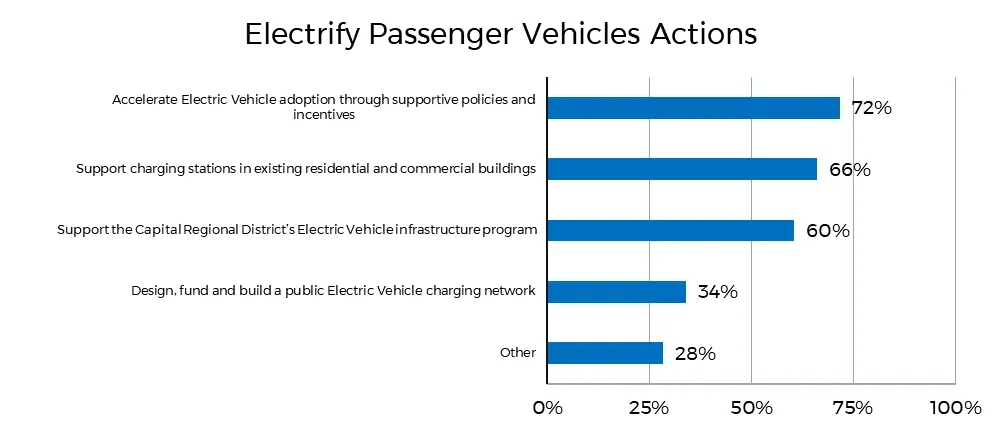
Electrify Passenger Vehicle Actions
Most actions received broad support of at least 60%, including using supportive policies and incentives to accelerate adoption (72%), supporting charging stations in existing residential and commercial buildings (66%), and supporting the Capital Regional District’s existing EV infrastructure program (60%). The only action which received low support was the design of a public EV charging network at 34%, however this is mitigated by support for a regional network through the Capital Regional District.
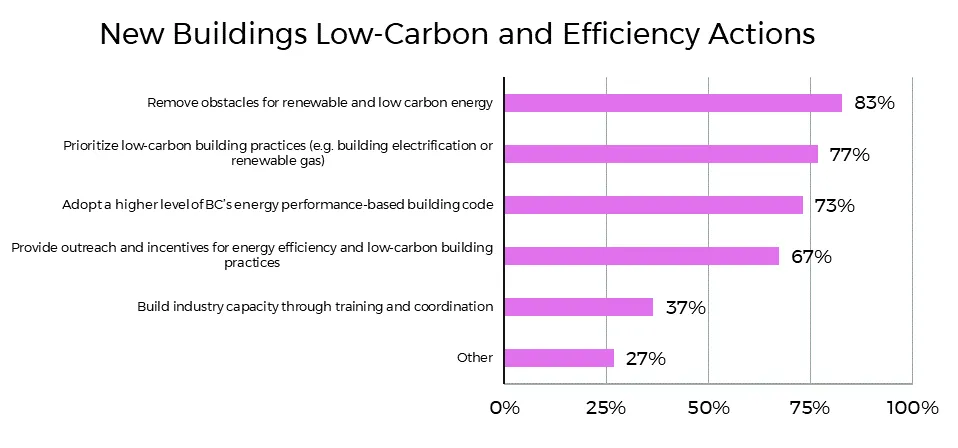
New Building Low-Carbon and Efficiency Actions
Although most actions elicited a high level of support of at least 67%, building industry capacity did not score high at only 37%. Building industry capacity, however, is already a bottleneck to energy efficient construction and should not be neglected if the community wishes to continue the decarbonisation of new buildings.
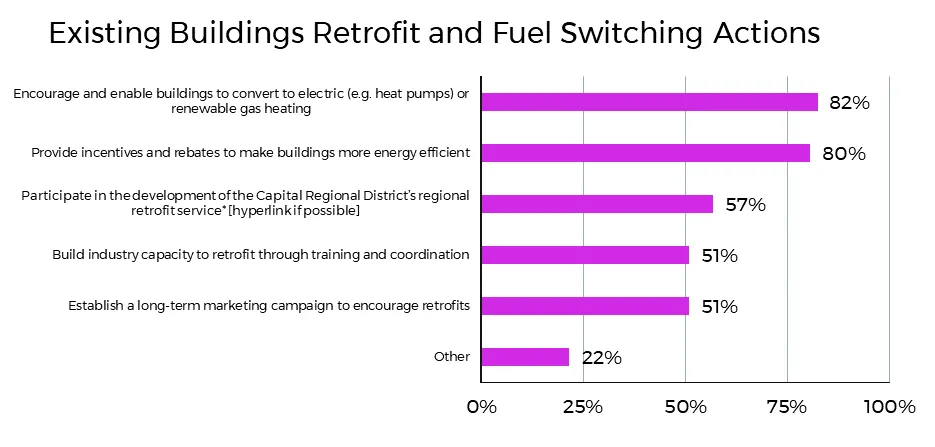
Existing Building Retrofit and Fuel Switching Actions
Heat pump and renewable gas adoption for heating scored very high amongst respondents, at 82%. Similarly, incentives and rebates for more energy efficient retrofits scored 80%. Interestingly, building industry capacity scored higher for existing buildings at 51%, vs. 37% for new buildings. Again, since industry capacity is already a bottleneck, it should be supported to optimize efforts to incentivize and encourage adoption.
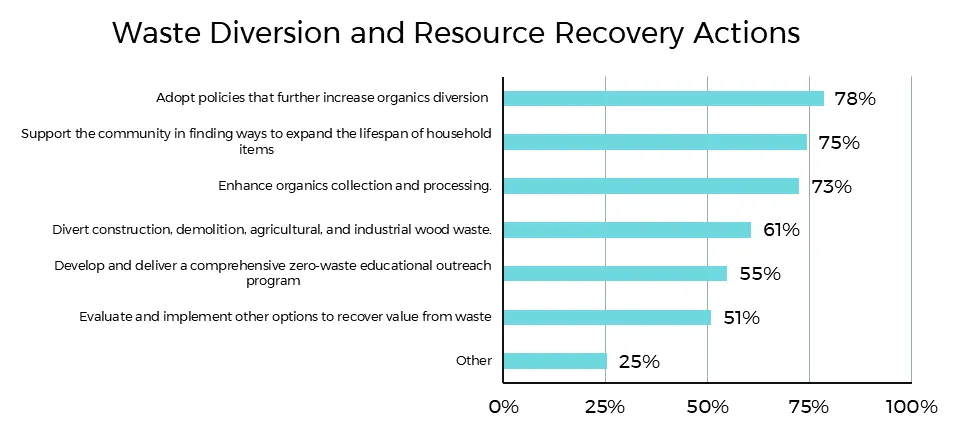
Waste Diversion and Resource Recovery Actions
Overall, all waste diversion and resource recovery actions were supported by at least half of respondents, with both policies to increase diversion and enhancing collection and processing receiving over 70% support. Expanding the lifespan of household items was also supported by three-quarters of respondents.
Demographic Quickstats (Survey #2)
| Age | Household income | Where do I Live | |||
|---|---|---|---|---|---|
| 18-35 | 17% | <$70k | 16% | Atkins | 21% |
| 36-55 | 27% | $70k - $100k | 23% | Burnside | 8% |
| 56-65 | 29% | $100k - $200k | 54% | Craigflower | 6% |
| >65 | 27% | >$200k | 7% | Harbour | 23% |
| Helmcken | 34% | ||||
| Hospital | 4% | ||||
| Thetis | 2% | ||||
| Wilfert | 2% |
Document Images
(7)