Attachment 2: Climate Action Strategy Summary
Excerpts from the 2012 Community Climate Action Plan showing relative emissions by sector and reduction targets.
Attachment 2
Climate Action Strategy Summary: Community Climate Action Plan and Corporate Energy and Emissions Plan
The 2012 Community Climate Action Plan includes:
a. A community inventory for energy and GHG emissions from residential buildings, commercial buildings, community transportation, and community solid waste
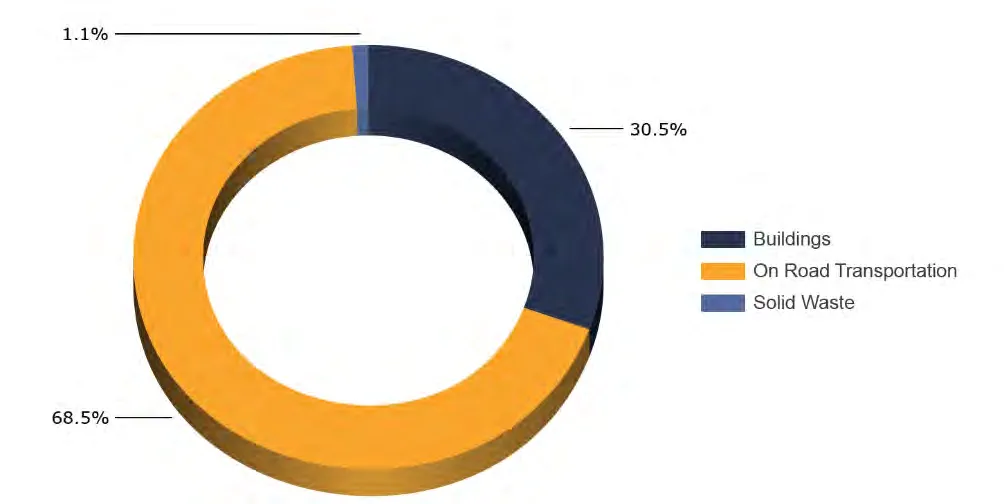
Figure 1. Relative emissions by sector (2007)
b. Modelling to forecast projected and targeted scenarios
Table 2.14 - Community Reduction Target Summary
| Sector | Base Year Emissions (2007) | Projected GHG Emissions with Legislation (2017) | Potential GHG Emission Reductions (2017) | GHG Emissions After Plan Implementation (2017) | Percent Reduction of Projected Emissions |
|---|---|---|---|---|---|
| Tonnes $CO_2e$ | |||||
| Residential Buildings | 3,860 | 3,670 | 631 | 3,039 | -21% |
| Commercial Buildings | 5,986 | 5,518 | 5,518 | -8% | |
| On Road Transportation | 22,119 | 23,216 | 3,507 | 19,086 | -14% |
| Solid Waste | 349 | 349 | 262 | 87 | -75.0% |
| Total | 32,314 | 32,753 | 4,400 | 28,353 | -12% |
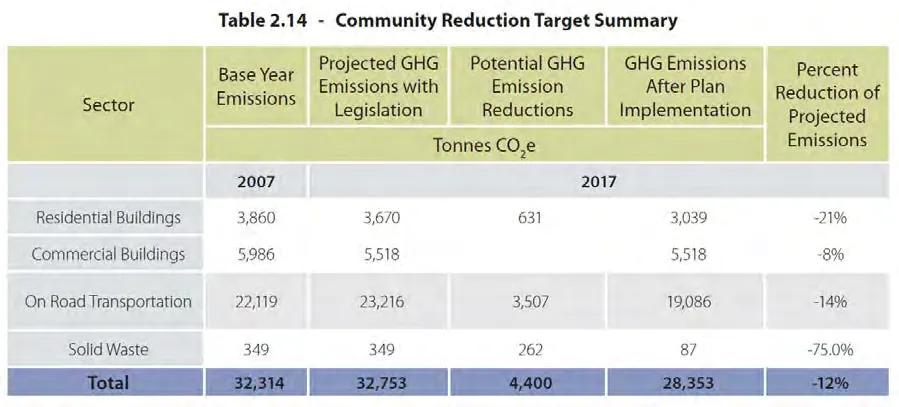
Figure 2. Model and target summary (excerpt)
c. Recommended policies and actions to support achievement of those targets, developed with public input
The inventory does not include air, water, and rail in the transportation sector nor agriculture and sequestration from trees.
What it does not include
- The Town’s own emissions are included in the data but the strategies to manage them is covered in the separate 2010 Corporate Energy and Emissions Plan. This plan is identified in the Financial Plan to be updated in 2023.
- It is important to note that the plan does not include a climate action adaptation and mitigation strategy, which would examine and determine approaches to manage risks such as the impact of anticipated sea level rise (including storm surges and tsunami risks) on private property and Town infrastructure (roads, sewer lift stations, stormwater outfalls, etc.).
2010 Corporate Energy and Emissions Plan
The 2010 Corporate Energy and Emissions Plan is a separate, guiding document for the Town’s operations. It is a detailed plan that examines the corporate inventory of municipal assets the associated emissions (e.g. building heating and cooling, fuel use, etc.), and provides forecasts of the future emissions and energy costs. The Town has been doing well on the corporate front and we have been carbon neutral in our operations for the past 7 years. 2019 was the first year where we were carbon neutral without the purchase of offsets.