Attachment 3: 2020 CRD Member Municipalities GHG Inventory Study
Comprehensive regional study by Stantec providing 2007 base year and 2018 reporting year emissions data for CRD local governments.
Capital Region District – Municipalities and Electoral Areas 2007 Base Year and 2018 Reporting Year Energy & GHG Emissions Inventory
Prepared for: Capital Regional District 625 Fisgard Street, PO Box 1000 Victoria, BC V8W 2S6
Prepared by: Stantec Consulting Ltd. 400-655 Tyee Road Victoria, BC, V9A 6X5
Date: June 24, 2020
Note: Pages 25-66 and 70-73 have been deleted
TABLE OF CONTENTS
- Summary - 4
- 1 Introduction - 6
- 1.1 GHG Emissions & Climate Change - 6
- 1.2 GPC Protocol - 7
- 1.3 Variance from Community Energy and Emissions Inventories (CEEI) - 7
- 1.4 Purpose of Document - 8
- 2 Inventory Scope - 9
- 2.1 GPC BASIC+ Inventory Scope - 9
- 2.2 GHG Emissions Boundary - 10
- 2.3 Assumptions & Disclosures - 10
- 3 Capital Regional District Energy & GHG Emissions - 13
- 3.1 Base Year (2007) Energy & GHG Emissions - 13
- 3.2 CRD GHG Reduction Target - 17
- 3.3 Reporting Year (2018) Energy & GHG Emissions - 17
- 3.4 Energy & GHG Emissions Trends - 21
- 4 District of Central Saanich - 25
- 4.1 2018 Profile - 25
- 4.2 Energy & GHG Emissions - 25
- 5 City of Colwood - 28
- 5.1 2018 Profile - 28
- 5.2 Energy & GHG Emissions - 28
- 6 Township of Esquimalt - 31
- 6.1 2018 Profile - 31
- 6.2 Energy & GHG Emissions - 31
- 7 District of Highlands - 34
- 7.1 2018 Profile - 34
- 7.2 Energy & GHG Emissions - 34
- 8 Juan de Fuca Electoral Area - 37
- 8.1 2018 Profile - 37
- 8.2 Energy & GHG Emissions - 37
- 9 City of Langford - 40
- 9.1 2018 Profile - 40
- 9.2 Energy & GHG Emissions - 40
- 10 District of Metchosin - 43
- 10.1 2018 Profile - 43
- 10.2 Energy & GHG Emissions - 43
- 11 District of North Saanich - 46
- 11.1 2018 Profile - 46
- 11.2 Energy & GHG Emissions - 46
- 12 District of Oak Bay - 49
- 12.1 2018 Profile - 49
- 12.2 Energy & GHG Emissions - 49
- 13 The District of Saanich - 52
- 13.1 2018 Profile - 52
- 13.2 Energy & GHG Emissions - 52
- 14 Salt Spring Electoral Area - 55
- 14.1 2018 Profile - 55
- 14.2 Energy & GHG Emissions - 55
- 15 Town of Sidney - 58
- 15.1 2018 Profile - 58
- 15.2 Energy & GHG Emissions - 58
- 16 District of Sooke - 61
- 16.1 2018 Profile - 61
- 16.2 Energy & GHG Emissions - 61
- 17 City of Victoria - 64
- 17.1 2018 Profile - 64
- 17.2 Energy & GHG Emissions - 64
- 18 Town of View Royal - 67
- 18.1 2018 Profile - 67
- 18.2 Energy & GHG Emissions - 67
- 19 Southern Gulf Islands Electoral Area - 70
- 19.1 2018 Profile - 70
- 19.2 Energy & GHG Emissions - 70
- Appendix A - 73
- Appendix B - 80
SUMMARY
Climate change has emerged as the next unprecedented social, economic, and environmental challenge facing society today. It poses a serious threat to quality of life, jobs, and physical and natural assets. Scientists believe that the human-production of greenhouse gas (GHG) emissions since pre-industrial times have already surpassed the Earth’s “carrying capacity” of natural systems and pose significant future risks to human well-being.
Recognizing the role that Capital Regional District (CRD) plays in achieving a significant and immediate reduction in global GHG emissions, the CRD set a regional GHG reduction target of 61% (from 2007 levels) by 2038. In February 2019, the CRD declared a climate emergency and committed to regional carbon neutrality. Local governments across the region have also set similar ambitious GHG reduction targets and commitments.
To meet these climate commitments, the CRD seeks a better understanding of the energy and GHG emissions at the regional level, as well as at the local government level which includes 13 municipalities and 3 electoral areas. The following document presents a summary of energy and GHG emissions at both the CRD and local government level for the 2007 and 2018 reporting years. This document compliments a 2018 inventory report which describes the methodologies and data sources applied to derive the estimate of GHG emissions for the CRD and local governments. A summary of the 2007 and 2018 energy and GHG emissions by local government is presented in Table 1 and Table 2.
Table 1. Summary of GHG Emissions By CRD Local Government
| Local Government | 2007 GHG Emissions (tCO2e) | 2018 GHG Emissions (tCO2e) | Change (%) |
|---|---|---|---|
| District of Central Saanich | 80,648 | 73,995 | -8.2% |
| City of Colwood | 80,838 | 78,506 | -2.9% |
| Township of Esquimalt | 95,893 | 85,786 | -10.5% |
| District of Highlands | 7,776 | 9,373 | 20.5% |
| Juan de Fuca Electoral Area* | 67,459 | 73,063 | 8.3% |
| City of Langford | 133,247 | 169,775 | 27.4% |
| District of Metchosin | 16,333 | 9,038 | -44.7% |
| District of North Saanich | 54,454 | 45,201 | -17.0% |
| District of Oak Bay | 89,140 | 77,178 | -13.4% |
| District of Saanich | 574,835 | 496,408 | -13.6% |
| Salt Spring Island Electoral Area* | 45,361 | 43,963 | -3.1% |
| Town of Sidney | 62,025 | 56,194 | -9.4% |
| District of Sooke | 46,616 | 46,574 | -0.1% |
| City of Victoria | 481,559 | 452,567 | -6.0% |
| Town of View Royal | 48,163 | 45,507 | -5.5% |
| Southern Gulf Islands Electoral Area* | 28,947 | 29,220 | 0.9% |
* Land-use GHG emission estimates have been withheld due to limited land-use data.
Table 2. Summary of Energy Use By CRD Local Government
| Local Government | 2007 Energy (GJ) | 2018 Energy (GJ) | Change (%) |
|---|---|---|---|
| District of Central Saanich | 1,865,308 | 1,941,408 | 4.1% |
| City of Colwood | 1,527,213 | 1,573,838 | 3.1% |
| Township of Esquimalt | 1,781,058 | 1,668,623 | -6.3% |
| District of Highlands | 220,027 | 274,687 | 24.8% |
| Juan de Fuca Electoral Area | 1,992,655 | 1,912,583 | -4.0% |
| City of Langford | 2,590,548 | 3,491,537 | 34.8% |
| District of Metchosin | 514,949 | 506,440 | -1.7% |
| District of North Saanich | 1,318,084 | 1,325,251 | 0.5% |
| District of Oak Bay | 1,654,197 | 1,547,417 | -6.5% |
| District of Saanich | 11,004,052 | 10,308,380 | -6.3% |
| Salt Spring Island Electoral Area | 608,477 | 633,681 | 4.1% |
| Town of Sidney | 1,229,020 | 1,188,309 | -3.3% |
| District of Sooke | 963,383 | 1,140,991 | 18.4% |
| City of Victoria | 9,830,828 | 9,436,659 | -4.0% |
| Town of View Royal | 959,422 | 998,682 | 4.1% |
| Southern Gulf Islands Electoral Area | 503,849 | 535,368 | 6.3% |
1 INTRODUCTION
1.1 GHG Emissions & Climate Change
There is overwhelming evidence that global climate change resulting from emissions of carbon dioxide and other greenhouse gases (GHGs) is having a significant impact on the ecology of the planet. In addition, climate change is expected to have serious negative impacts on global economic growth and development. In 2005, the UK government commissioned an independent economic review called the Stern Review, which states that the “costs of stabilizing the climate are significant but manageable; delay would be dangerous and much more costly”.
Beyond the costs associated with delayed action, there are cost savings to be realized through efforts to conserve energy and to use it more efficiently, and economic opportunities available to communities that develop local energy supply and infrastructure. Actions to encourage energy efficiency and conservation and to promote implementation of renewable energy will assist local governments in developing energy resilient communities, in addition to mitigating climate change. Local governments are at the forefront of global action on climate change, setting both ambitious commitments and targets while going about the difficult task of reducing emissions. Per the latest report from the C40 Cities Climate Leadership Group, ICLEI Local Governments for Sustainability, UN Habitat, and others, most GHG reduction commitments are set for 2020 or 2050 and range from a 10% to 100% reduction (Figure 1).
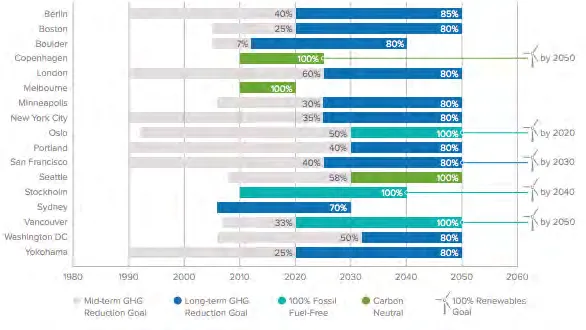
Figure 1. Summary of Long-Term Global GHG Emission Reduction Targets
1.2 GPC Protocol
To make informed decisions on reducing energy use and GHG emissions at the regional and local government scale, community managers must have a good understanding of these sources, the activities that drive them, and their relative contribution to the total. This requires the completion of an energy and GHG emissions inventory. To allow for credible and meaningful reporting locally and internationally, the Global Protocol for Community-Scale Greenhouse Gas Emission Inventories (the GPC Protocol) was developed as a partnership between ICLEI-Local Governments for Sustainability, The World Resources Institute (WRI) and C40 Cities Climate Leadership Group (C40), with additional collaboration by the World Bank, United Nations Environment Program (UNEP) and UN-Habitat. The GPC Protocol has now become recognized as the standardized way for local governments to collect and report their actions on climate change. Over 9,000 cities have committed to using the GPC Protocol.
The Protocol has two established levels of reporting: BASIC and BASIC+ which are defined as the following:
- The BASIC level covers scope 1 and scope 2 emissions from stationary energy and in-boundary transportation, as well as scope 1 and scope 3 emissions from waste.
- The BASIC+ level covers the same scopes as BASIC and includes more in-depth and data dependent methodologies. Specifically, it expands the reporting scope to include emissions from industrial process and product use (IPPU), agriculture, forestry and other land-use (AFOLU), and transboundary transportation.
1.3 Variance from Community Energy and Emissions Inventories (CEEI)
The CRD has historically relied on the Provincial 2007, 2010 and 2012 Community Energy and Emissions Inventories (CEEI) to baseline and track community GHG emissions. However, there have been some limitations to the CEEI in that it is an in-boundary inventory, the most recent version published is for 2012, and the CEEI Protocol does not fully meet the requirements of the GPC Protocol BASIC or BASIC+ reporting requirements which is the required reporting standard for local governments that have committed to the Global Covenant of Mayors—an agreement led by city networks to undertake a transparent and supportive approach to measure GHG emissions community-wide. A high-level summary of the differences between the CEEI and GPC Protocol inventories are presented in Table 3.
Table 3. Summary of GHG Inventory Scope Differences
| Reporting Sector | CEEI | GPC BASIC | GPC BASIC+ |
|---|---|---|---|
| Residential Buildings | ✓ | ✓ | ✓ |
| Commercial And Institutional Buildings And Facilities | ✓ | ✓ | ✓ |
| Manufacturing Industries And Construction | ✓ | ✓ | ✓ |
| Energy Industries | ✓ | ✓ | |
| Energy Generation Supplied To The Grid | ✓ | ✓ | |
| Agriculture, Forestry And Fishing Activities | ✓ | ✓ | |
| Non-Specified Sources | ✓ | ✓ | |
| Fugitive Emissions From Mining, Processing, Storage, And Transportation Of Coal | ✓ | ✓ | |
| Fugitive Emissions From Oil And Natural Gas Systems | ✓ | ✓ | |
| On-Road Transportation | ✓ | ✓ | ✓ |
| Railways | ✓ | ✓ | |
| Waterborne Navigation | ✓ | ✓ | |
| Aviation | ✓ | ✓ | |
| Off-Road Transportation | ✓ | ✓ | |
| Solid Waste | ✓ | ✓ | ✓ |
| Biological Waste | ✓ | ✓ | ✓ |
| Incinerated And Burned Waste | ✓ | ✓ | |
| Wastewater | ✓ | ✓ | |
| Emissions From Industrial Processes | ✓ | ||
| Emissions From Product Use | ✓ | ||
| Emissions From Livestock | ✓ | ✓ | |
| Emissions From Land | ✓ | ||
| Emissions From Aggregate Sources And Non-CO2 Emission Sources On Land | ✓ | ✓ |
1.4 Purpose of Document
The purpose of this document is to provide the 2007 and 2018 GPC BASIC+ energy and GHG emissions inventories at the regional and local government level. This document compliments a 2018 inventory report which describes the methodologies and data sources applied to derive the estimate of GHG emissions for the CRD region and local governments.
2 INVENTORY SCOPE
2.1 GPC BASIC+ Inventory Scope
In accordance with the GPC Protocol, the 2007 and 2018 BASIC+ GHG inventories presented herein accounts for GHG emissions from the following Reporting Sectors:
- Stationary Energy – These are GHG emissions from fuel combustion, fugitive emissions, and some off-road transportation sources (e.g. construction equipment, residential mowers, etc.). They include the emissions from energy to heat and cool residential, commercial, institutional, and light/heavy industrial buildings, as well as the activities that occur within these residences and facilities.
- Transportation – These are GHG emissions from the combustion of fuels as a result of vehicular on-road, off-road, including marine, aviation, and other off-road, and trans-boundary journeys.
- Waste – These are GHG emissions from the disposal and management of solid waste, the biological treatment of waste, and wastewater treatment and discharge. Waste does not directly consume energy, but releases GHG emissions because of decomposition, burning, and other management methods.
- Industrial Process and Product Use (IPPU) – These are GHG emissions from products such as refrigerants, foams or aerosol cans can release potent GHG emissions, known as product use GHG emissions. There are no known industrial process emissions in the CRD.
- Agriculture, Forestry and Other Land-Use (AFOLU) – These are GHG emissions that are captured or released as a result of land-management activities. These activities can range from the preservation of forested lands to the development of crop land. This Sector includes GHG emissions from land-use change, manure management, livestock, and the direct and indirect release of nitrous oxides (N2O) from soil management, urea application, fertilizer and manure application.
2.2 GHG Emissions Boundary
The GHG inventories are defined geographically by the CRD, which includes 13 municipalities and 3 electoral areas, as shown in Figure 2.
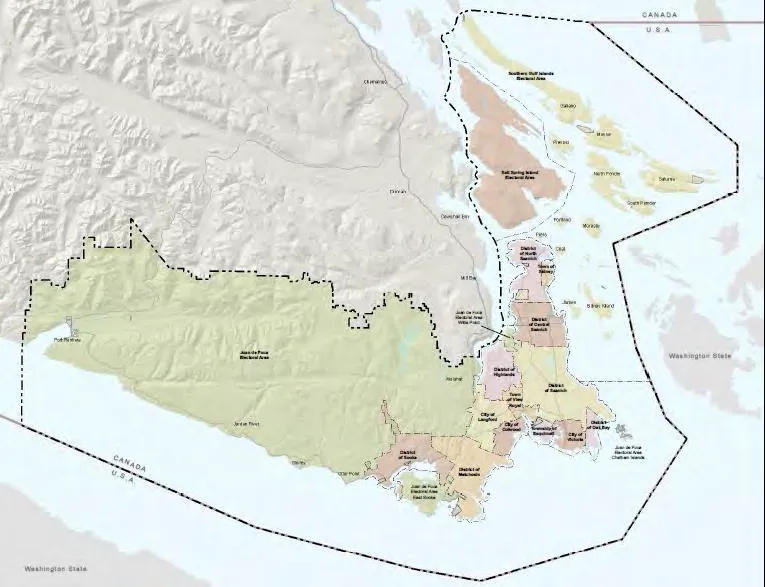
Figure 2. CRD GHG Boundary
2.3 Assumptions & Disclosures
The following inventories covers all GHG emissions for the 2007 and 2018 reporting years. Where data was not available, the most recent year’s data have been used, and the timescale noted accordingly. These disclosures are as follows:
- Global Warming Potentials (GWP). The BC government is currently applying GWPs from the fourth IPCC report in light of the fact that there are updated GWPs in available in the fifth IPCC report. On this basis, the following GHG emissions inventories apply GWPs from the fourth IPCC report.
- Stationary Energy: Propane, Wood and Fuel Oil – Residential Buildings. Propane, and wood GHG emissions were estimated using linear regression methods. The data used in the estimates included historical propane and wood energy data published in the 2007, 2010 and 2012 CEEIs, and heating degree days (HDD) published by Environment Canada. This approach was also applied to the estimate of heating oil for all local governments, except the City of Victoria and District of Saanich. For the District of Saanich and the City of Victoria, heating oil GHG emissions were estimated based on the number of known tanks, average heated floor areas and estimated average fuel volumes.
- Stationary Energy: Electricity and Natural Gas Consumption - All Buildings. Prior to releasing the electricity and natural gas consumption data, the Province completes a series of quality assurance and control checks which has resulted in the re-allocation of energy between local governments. This data is then published on the Province’s website. When the published 2007-2018 natural gas data was trended, several unexplained data anomalies and trends were identified for several local governments in the CRD. As these data anomalies and trends could not readily be explained, the raw natural gas data sets were acquired from FortisBC, reviewed and compared to the published data. In the 2007 and 2010 reporting years, the published data was under reporting natural gas volumes by upwards of 17% at the CRD level and had several large allocations between the City of Victoria and other local governments in 2012. Based on the issues with the published data, and on the basis the annual raw natural gas consumption trends align with the reported 2018 consumption data and align with historical raw data provided to the City of Victoria and the District of Saanich for their energy and GHG emissions inventories, the raw FortisBC dataset was used to estimate GHG emissions. A similar issue was noted for the Juan de Fuca electoral area and electricity data for the 2007, 2010 and 2012 reporting years (i.e., the under reporting of energy consumption) in the published data. As such, the raw electricity data from BC Hydro was used to estimate GHG emissions.
- Stationary Energy: Fugitives. FortisBC provided total fugitive emissions for the 2018 reporting year at the regional level. To estimate local government fugitive emissions, the value was prorated based on the number of reported natural gas connections (provided by Fortis BC). Since no historical numbers were provided, the 2018 value was applied to the 2007 base year as well. The estimate of fugitive emissions is an understatement of GHG emissions as FortisBC did not estimate the upstream GHG emissions as recommended by the GPC Protocol.
- Transportation: On-Road. The Province of BC provided Insurance Corporation of BC (ICBC) vehicle registration data from April 1, 2018 – March 31, 2019. When compared to local government population trends, there appears to be a high degree of uncertainty as to the accuracy of the 2018 vehicle registration data in terms of total registered vehicles. Without having reliable historical (e.g. 2011-2017) and current (2019) data to compare this dataset against, the reasonableness of the data was too uncertain to be applied in the estimation of GHG emissions for the 2018 reporting year. Therefore, to estimate on-road energy and GHG emissions for the 2018 reporting year, 2010 vehicle populations were grown in proportion to the reported changes in local government populations. Each of the local government vehicle profiles were then adjusted to match the proportion of vehicle classes reported in the 2018 ICBC data.
- Transportation: On-Road. In cases where vehicle registration counts were 10 or less, the Province assigned a value of “<10” rather than report the actual number. In these cases, the inventory assumes there was 10 vehicles of that particular classification. This is likely to result in an over-estimation of GHG emissions, but it will be immaterial to the overall GHG inventory.
- Transportation: On-Road. Vehicle fuel consumption rates and Vehicle Kilometer Travelled (VKT) were taken from the activity data summary for British Columbia on-road transportation from the 2018 National Inventory Report (1990-2018) as prepared by Environment Canada. Based on the clear diesel and clear gasoline consumption values reported by the Province of BC for the Victoria region, the VKT and fuel efficiency values are reasonable and result in a similar estimate of fuel consumption for the Region.
- Transportation: Aviation. 2018 aviation GHG emissions were estimated using 2015 aircraft flight profiles (the last available data), and the total number of aircraft movements reported in 2018. The emissions were prorated to each local government on a per capita basis.
- Transportation: Waterborne Recreational Watercraft. GHG emissions from recreational watercraft and US/Canada ferries were estimated based on a publicly available year 2000 study for the Victoria, Vancouver, and Washington harbors. These GHG emissions were prorated to each local government on a per capita basis.
- Transportation: Cruise Ships. The Greater Victoria Harbour Authority reported on cruise ship emissions for the 2018 reporting year but did not provide an estimate for 2007. As a result, no cruise ship emissions are included in the 2007 base year inventory.
- Waste: Solid Waste. To quantify GHG emissions from the Hartland Landfill, the CRD utilized the waste-in-place (WIP) method which is accepted under the GPC Protocol. The WIP assigns landfill emissions based on total waste deposited during that year. It counts GHGs emitted that year, regardless of when the waste was disposed. Except for the City of Victoria, who claims 31% of the CRD’s landfill GHG emission, the remaining landfill GHG emissions were allocated to each local government on a per capita basis. Using this allocation method, the CRD members may over, or underestimate associated solid waste GHG emissions as the current year landfill GHG emissions are based upon cumulative waste over time, and each member may have contributed more waste in past years than the current year (and vice versa).
- AFOLU: Aggregate Sources And Non-CO2 Emission Sources On Land. These emissions are based on the 2019 NIR as prepared by ECCC and the total area of farmland BC in 2016 as reported by Statistics Canada. These GHG emissions were assigned to each local government on a per hectare (ha) of cropland basis.
- AFOLU: Land-Use. The land cover change analysis requires a consistent land-use category attribution and spatial resolution for the 2007 base and 2018 reporting years. For the land use change analysis, land cover data was available for the 2007, 2011 and 2017 years for only part of the CRD. Unfortunately, no more recent or higher quality data source was available to represent the land cover consistently for all three years. Furthermore, since annual data was not available, the change between land cover data years (2007-2011, 2011-2017) was averaged and may not represent actual changes in each year.
- AFOLU: Land-Use. There was limited land-use datasets for the Juan de Fuca, Salt Spring Island and Gulf Island Electoral Areas and this data was only available for 2007 and 2011. On this basis, land-use GHG emissions estimates for these electoral areas has been withheld.
Details surrounding all GHG emissions sources quantification methods, assumptions, and assessment of uncertainties are contained in a complimentary GHG emissions methodology document and are not be presented herein.
3 CAPITAL REGIONAL DISTRICT ENERGY & GHG EMISSIONS
3.1 Base Year (2007) Energy & GHG Emissions
In 2007, the CRD’s GHG BASIC+ emissions totaled 1,715,814 tCO2e. Excluding land use GHG emissions, buildings are the CRD’s second largest GHG emissions source at 33%, with 42% of those GHG emissions coming from natural gas for heating and cooling, 22% from heating oil for heating, 12% from electricity use, 8% from wood and propane use for heating and the remainder from other-related off-road activities like residential lawn mowing. On-road transportation GHG emission sources contributed 46% to the GHG inventory, almost all of which came from passenger vehicles, light trucks, and SUVs (85%). Off-road transportation, which includes marine, aviation, and other off-road emission sources contributed 7% to the overall GHG inventory. Solid waste, organic waste treatment methods, and wastewater treatment and discharge accounted for 7% of the total community GHG emissions. IPPU emissions accounted for 4% of total GHG emissions while AFOLU GHG emissions resulted in a reduction of 13% of community GHG emissions through the sequestration and storage of carbon.
A summary of the GHG emissions by sector and energy use by source is presented in the following table and figures.
Table 4. Base Year (2007) CRD Regional GHG Energy & GHG Emissions by Source
| Source | Type | Consumption | Units | Energy (GJ) | GHG Emissions (tCO2e) |
|---|---|---|---|---|---|
| Stationary Energy | |||||
| Residential Buildings | Electricity | 2,107,163 | MWh | 7,585,725 | 52,679 |
| Natural Gas | 2,639,980 | GJ | 2,639,980 | 131,649 | |
| Fuel Oil | 83,335 | L | 2,147,821 | 146,859 | |
| Propane | 10,747 | L | 424,600 | 25,882 | |
| Wood | 1,144,369 | GJ | 1,144,369 | 26,872 | |
| Diesel | 6,507,150 | L | 251,697 | 19,468 | |
| Commercial & Industrial Buildings | Electricity | 1,365,217 | MWh | 4,914,742 | 34,130 |
| Natural Gas | 3,352,456 | GJ | 3,352,456 | 167,179 | |
| Fuel Oil | 6,272 | L | 161,638 | 11,052 | |
| Diesel | 11,734,206 | L | 453,879 | 35,106 | |
| Energy Industries | LFG Combustion | 418 | |||
| Agriculture, Forestry And Fishing Activities | Diesel | 20,743,755 | L | 802,368 | 62,060 |
| Natural Gas Fugitive Emissions | 993 | ||||
| Total Stationary Energy | 23,879,274 | 714,348 | |||
| On-Road Transportation | |||||
| Electric Vehicles | Electricity | 6,622 | MWh | 23,840 | 0 |
| Passenger Vehicles | Gasoline + Diesel + Propane | 163,062,222 | L | 5,673,042 | 403,626 |
| Light Trucks, Vans, SUVs | Gasoline + Diesel + Propane | 151,774,389 | L | 5,237,495 | 370,284 |
| Heavy Duty Vehicles | Gasoline + Diesel + Propane | 53,493,257 | L | 2,012,033 | 140,949 |
| Motorcycles | Gasoline + Diesel + Propane | 1,208,124 | L | 41,874 | 2,885 |
| Total On-Road Transportation | 12,964,443 | 917,744 | |||
| Off-Road Transportation | |||||
| Marine, Aviation and Other Off-Road Vehicles | Marine Gasoline + Marine Diesel + Jet Fuel | 45,492,152 | L | 1,719,352 | 130,172 |
| Total Off-Road Transportation | 1,719,352 | 130,172 | |||
| Waste | |||||
| Wastewater | 18,998 | ||||
| Composting | 72 | ||||
| Solid Waste | 111,234 | ||||
| Total Waste | 130,304 | ||||
| Agriculture Forestry & Other Land Use (AFOLU) | |||||
| Land-Use | -259,033 | ||||
| Livestock, Aggregate Sources and Non-CO2 Emission Sources on Land | 4,930 | ||||
| Total AFOLU | -254,103 | ||||
| Industrial Process & Product Use (IPPU) | |||||
| Process Use Emissions | 77,348 | ||||
| Total IPPU | 77,348 | ||||
| TOTAL | 38,563,069 | 1,715,814 | |||
| TOTAL Per Capita | 109.7 | 4.9 |
Energy consumption and GHG emissions by source are shown in Figure 3, Figure 4 and Figure 5. On-road and transboundary transportation (82%) account for most of the energy consumption in the region.
[Chart: Figure 3. 2007 Regional Energy Consumption By Sector - On-Road Transportation 81.7%, Waterbourne Navigation and Aviation 8.7%, Other Stationary Energy 5.1%, Commerial and Instituional Buildings 2.9%, Residential Buildings 1.7%]
Figure 3. 2007 Regional Energy Consumption By Sector
[Chart: Figure 4. 2007 Regional GHG Emissions By Sector (Excluding Land Use) - On-Road Transportation 46.5%, Residential Buildings 20.4%, Commerial and Instituional Buildings 12.5%, Waste 6.6%, IPPU 3.9%, Waterbourn Navigation and Aviation 3.7%, Other Stationary Energy 3.2%, Other Off-Road Transport 2.9%, Livestock and Aggregate Sources 0.2%]
Figure 4. 2007 Regional GHG Emissions By Sector (Excluding Land Use)
[Chart: Figure 5. 2007 Regional GHG Emissions By Sector (Including Land Use) - On-Road Transportation 41.1%, Residential Buildings 18.1%, Commerial and Instituional Buildings 11.1%, Land-Use -11.6%, Waste 5.8%, IPPU 3.5%, Waterbourn Navigation and Aviation 3.3%, Other Stationary Energy 2.8%, Other Off-Road Transport 2.5%, Livestock and Aggregate Sources 0.2%]
Figure 5. 2007 Regional GHG Emissions By Sector (Including Land Use)
GHG emissions by fuel type is presented in Figure 6.
[Chart: Figure 6. 2007 Regional GHG Emissions By Fuel Type - Gasoline 42.0%, Diesel 21.9%, Natural Gas 17.0%, Heating Oil 9.0%, Electricity 4.9%, Propane 2.3%, Wood 1.5%, Jet Fuel 1.5%]
Figure 6. 2007 Regional GHG Emissions By Fuel Type
3.2 CRD GHG Reduction Target
Recognizing the role that the CRD plays in achieving a significant and immediate reduction in global GHG emissions, the CRD has set a regional GHG reduction target of 61% (from 2007 levels) by 2038. With the CRD’s 2007 base year GHG emissions being 1,715,814 tCO2e, a 39% reduction would require a reduction of approximately 669,168 tCO2e. On a per capita basis, this amounts to reducing emissions from approximately 4.2 tCO2e per person in 2018 to 2.6 tCO2e per person by 2038.
In February 2019, the CRD declared a climate emergency and committed to regional carbon neutrality.
3.3 Reporting Year (2018) Energy & GHG Emissions
In 2018, the CRD’s BASIC+ GHG emissions totaled 1,696,703 tCO2e. While this is a small decline of 1.1% from the 2007 base year GHG emissions, on an absolute basis, it is a decline of 14% on a per capita basis. Between 2007 and 2018, the CRD’s population has grown 15% and thus this decline speaks to the efforts by the CRD and CRD local governments to reduce energy consumption and GHG emissions.
Similar to the 2007 base year, buildings are the second largest GHG emissions source at 32%, with 48% of those GHG emissions coming from natural gas for heating and cooling, 23% from heating oil for heating, 5% from electricity use, 8% from wood and propane use for heating and the remainder from other-related off-road activities like residential lawn mowing. On-road transportation GHG emission sources contributed 46%, almost all of which came from passenger vehicles, light trucks, and SUVs (86%). Off-road transportation, which includes marine, aviation, and other off-road emission sources contributed 7% to the overall GHG inventory. Solid waste, organic waste treatment methods, and wastewater treatment and discharge accounted for 5% of the total community GHG emissions. IPPU emissions accounted for 7% of total GHG emissions while AFOLU GHG emissions resulted in a reduction of 11% of community GHG emissions through the sequestration and storage of carbon.
A summary of the 2018 GHG emissions by sector and energy use by source is presented in the following table and figures.
Table 5. Reporting Year (2018) CRD Regional GHG Energy & GHG Emissions by Sector
| Source | Type | Consumption | Units | Energy (GJ) | GHG Emissions (tCO2e) |
|---|---|---|---|---|---|
| Stationary Energy | |||||
| Residential Buildings | Electricity | 1,920,909 | MWh | 6,915,217 | 20,496 |
| Natural Gas | 2,218,511 | GJ | 2,218,511 | 110,632 | |
| Fuel Oil | 80,580 | L | 2,076,809 | 142,004 | |
| Propane | 10,169 | L | 401,770 | 24,569 | |
| Wood | 1,100,555 | GJ | 1,100,555 | 25,843 | |
| Diesel | 5,434,847 | L | 210,220 | 15,252 | |
| Commercial & Industrial Buildings | Electricity | 1,290,843 | MWh | 4,646,998 | 13,773 |
| Natural Gas | 4,192,845 | GJ | 4,192,845 | 209,087 | |
| Fuel Oil | 5,549 | L | 143,003 | 9,778 | |
| Diesel | 11,683,072 | L | 451,901 | 32,786 | |
| Energy Industries | LFG Combustion | 7,658 | |||
| Agriculture, Forestry And Fishing Activities | Diesel | 19,879,416 | L | 768,936 | 55,787 |
| Natural Gas Fugitive Emissions | 1,510 | ||||
| Total Stationary Energy | 23,126,766 | 669,175 | |||
| On-Road Transportation | |||||
| Electric Vehicles | Electricity | 6,622 | MWh | 24 | 80 |
| Passenger Vehicles | Gasoline + Diesel + Propane | 146,887,432 | L | 5,104,833 | 328,408 |
| Light Trucks, Vans, SUVs | Gasoline + Diesel + Propane | 190,281,535 | L | 6,653,532 | 426,624 |
| Heavy Duty Vehicles | Gasoline + Diesel + Propane | 49,689,669 | L | 1,863,143 | 121,922 |
| Motorcycles | Gasoline | 885,376 | L | 30,687 | 2,114 |
| Total On-Road Transportation | 13,652,220 | 879,148 | |||
| Off-Road Transportation | |||||
| Marine, Aviation and Other Off-Road Vehicles | Marine Gasoline + Marine Diesel + Jet Fuel | 44,843,853 | L | 1,704,868 | 126,061 |
| Total Off-Road Transportation | 1,704,868 | 126,061 | |||
| Waste | |||||
| Wastewater | 19,859 | ||||
| Composting | 5,307 | ||||
| Solid Waste | 71,219 | ||||
| Total Waste | 96,386 | ||||
| Agriculture Forestry & Other Land Use (AFOLU) | |||||
| Land-Use | -209,262 | ||||
| Livestock, Aggregate Sources and Non-CO2 Emission Sources on Land | 4,930 | ||||
| Total AFOLU | -203,952 | ||||
| Industrial Process & Product Use (IPPU) | |||||
| Process Use Emissions | 129,884 | ||||
| Total IPPU | 129,884 | ||||
| TOTAL | 38,483,853 | 1,696,703 | |||
| TOTAL Per Capita | 94.8 | 4.2 |
Energy consumption and GHG emissions by source are shown in Figure 7, Figure 8 and Figure 9. On-road and transboundary transportation (82%) account for most of the energy consumption in the region.
[Chart: Figure 7. 2018 Regional Energy Consumption By Sector - On-Road Transportation 82.5%, Waterbourn Navigation and Aviation 8.7%, Other Stationary Energy 4.6%, Commerial and Instituional Buildings 2.8%, Residential Buildings 1.3%]
Figure 7. 2018 Regional Energy Consumption By Sector
[Chart: Figure 8. 2018 Regional GHG Emissions By Sector (Excluding Land Use) - On-Road Transportation 46.1%, Residential Buildings 17.8%, Commerial and Instituional Buildings 13.9%, IPPU 6.8%, Waste 5.1%, Waterbourn Navigation and Aviation 3.7%, Other Stationary Energy 3.4%, Other Off-Road Transport 2.9%, Livestock and Aggregate Sources 0.3%]
Figure 8. 2018 Regional GHG Emissions By Sector (Excluding Land Use)
[Chart: Figure 9. 2018 Regional GHG Emissions By Sector (Including Land Use) - On-Road Transportation 41.6%, Residential Buildings 16.0%, Commerial and Instituional Buildings 12.5%, Land-Use -9.9%, IPPU 6.1%, Waste 4.6%, Waterbourn Navigation and Aviation 3.3%, Other Stationary Energy 3.1%, Other Off-Road Transport 2.6%, Livestock and Aggregate Sources 0.3%]
Figure 9. 2018 Regional GHG Emissions By Sector (Including Land Use)
GHG emissions by fuel type is presented in Figure 10.
[Chart: Figure 10. 2018 Regional GHG Emissions By Fuel Type - Gasoline 44.3%, Diesel 20.8%, Natural Gas 19.6%, Heating Oil 9.1%, Electricity 2.1%, Wood 1.5%, Propane 1.5%, Jet Fuel 1.2%]
Figure 10. 2018 Regional GHG Emissions By Fuel Type
3.4 Energy & GHG Emissions Trends
Table 6 presents the changes between the 2007 and 2018 reporting years, showing that emissions decreased in most reporting sectors. There was an increase in commercial buildings natural gas consumption and building related natural gas fugitive emissions which is expected as the CRD population has grown. There was also an increase in process use emissions (67%) which is also driven by population. Lastly, there was an increase in composting emissions which is the direct result of waste diversion programs which result in some direct GHG emissions, but overall have a net reduction impact as the process avoids releasing more fugitive emissions from the landfill. Total waste emissions declined 26% from the base year as a result.
GHG emissions resulting from residential buildings have declined by 16% as a result of improved efficiency of appliances and lighting, energy efficiency upgrades, and a transition from heating oil to natural gas or electric heating. In contrast, GHG emissions from commercial and institutional buildings has increased 7% since the base year which is likely to the expanding population and the increased construction of multi-unit residential buildings in the region (which are classified by the utilities as commercial buildings). Overall, stationary energy emissions, which includes buildings, fugitives, and other off-road emission sources have declined by 6% since the base year.
On-road transportation GHG emissions have decreased 4% in light of a 15% increase in the number of registered vehicles and a trend away from light duty vehicles, like sedans, towards SUVs and light duty trucks which have lower fuel efficiencies. This increase has been mitigated by shifting preferences towards electric vehicles, Provincial renewable fuel requirements and people simply driving less. Overall, transportation GHG emissions have declined 4% since the base year.
Land-use GHG emissions increased 20% as a result of more infill and less greenspace development.
Table 6. Change in CRD GHG Energy & GHG Emissions
| Source | Type | 2007 Energy (GJ) | 2018 Energy (GJ) | Change (%) | 2007 GHG Emissions (tCO2e) | 2018 GHG Emissions (tCO2e) | Change (%) |
|---|---|---|---|---|---|---|---|
| Stationary Energy | |||||||
| Residential Buildings | Electricity | 7,585,725 | 6,915,217 | -8.8% | 52,679 | 20,496 | -61.1% |
| Natural Gas | 2,639,980 | 2,218,511 | -16.0% | 131,649 | 110,632 | -16.0% | |
| Fuel Oil | 2,147,821 | 2,076,809 | -3.3% | 146,859 | 142,004 | -3.3% | |
| Propane | 424,600 | 401,770 | -5.4% | 25,882 | 24,569 | -5.1% | |
| Wood | 1,144,369 | 1,100,555 | -3.8% | 26,872 | 25,843 | -3.8% | |
| Diesel | 251,697 | 210,220 | -16.5% | 19,468 | 15,252 | -21.7% | |
| Commercial & Industrial Buildings | Electricity | 4,914,742 | 4,646,998 | -5.4% | 34,130 | 13,773 | -59.6% |
| Natural Gas | 3,352,456 | 4,192,845 | 25.1% | 167,179 | 209,087 | 25.1% | |
| Fuel Oil | 161,638 | 143,003 | -11.5% | 11,052 | 9,778 | -11.5% | |
| Diesel | 453,879 | 451,901 | -0.4% | 35,106 | 32,786 | -6.6% | |
| Energy Industries | LFG Combustion | - | - | 418 | 7,658 | 1731.0% | |
| Agriculture, Forestry And Fishing Activities | Diesel | 802,368 | 768,936 | -4.2% | 62,060 | 55,787 | -10.1% |
| Natural Gas Fugitive Emissions | - | - | 993 | 1,510 | 52.0% | ||
| Total Stationary Energy | 23,879,274 | 23,126,766 | -3.2% | 714,348 | 669,175 | -6.3% | |
| On-Road Transportation | |||||||
| Electric Vehicles | Electricity | - | 24 | - | - | 80 | - |
| Passenger Vehicles | Gasoline + Diesel + Propane | 5,673,042 | 5,104,833 | -10.0% | 403,626 | 328,408 | -18.6% |
| Light Trucks, Vans, SUVs | Gasoline + Diesel + Propane | 5,237,495 | 6,653,532 | 27.0% | 370,284 | 426,624 | 15.2% |
| Heavy Duty Vehicles | Gasoline + Diesel + Propane | 2,012,033 | 1,863,143 | -7.4% | 140,949 | 121,922 | -13.5% |
| Motorcycles | Gasoline | 41,874 | 30,687 | -26.7% | 2,885 | 2,114 | -26.7% |
| Total On-Road Transportation | 12,964,443 | 13,652,220 | 5.3% | 917,744 | 879,148 | -4.2% | |
| Off-Road Transportation | |||||||
| Marine, Aviation and Other Off-Road Vehicles | Marine Gasoline + Marine Diesel + Jet Fuel | 1,719,352 | 1,704,868 | -0.8% | 130,172 | 126,061 | -3.2% |
| Total Off-Road Transportation | 1,719,352 | 1,704,868 | -0.8% | 130,172 | 126,061 | -3.2% | |
| Waste | |||||||
| Wastewater | 18,998 | 19,859 | 4.5% | ||||
| Composting | 72 | 5,307 | 7235.5% | ||||
| Solid Waste | 111,234 | 71,219 | -36.0% | ||||
| Total Waste | 130,304 | 96,386 | -26.0% | ||||
| Agriculture Forestry & Other Land Use (AFOLU) | |||||||
| Land-Use | -259,033 | -209,262 | -19.2% | ||||
| Livestock, Aggregate Sources and Non-CO2 Emission Sources on Land | 4,930 | 5,310 | |||||
| Total AFOLU | -254,103 | -203,952 | -19.7% | ||||
| Industrial Process & Product Use (IPPU) | |||||||
| Process Use Emissions | 77,348 | 129,884 | 67.9% | ||||
| Total IPPU | 77,348 | 129,884 | 67.9% | ||||
| TOTAL | 38,563,069 | 38,483,853 | -0.2% | 1,715,814 | 1,696,703 | -1.1% |
Table 7 presents the changes between the 2007 and 2018 years for each CRD local government.
Table 7. Change in Member GHG Energy & GHG Emissions
| Member | 2007 Energy (GJ) | 2018 Energy (GJ) | Change (%) | 2007 GHG Emissions (tCO2e) | 2018 GHG Emissions (tCO2e) | Change (%) |
|---|---|---|---|---|---|---|
| District of Central Saanich | 1,865,308 | 1,941,408 | 4.1% | 80,648 | 73,995 | -8.2% |
| City of Colwood | 1,527,213 | 1,573,838 | 3.1% | 80,838 | 78,506 | -2.9% |
| Township of Esquimalt | 1,781,058 | 1,668,623 | -6.3% | 95,893 | 85,786 | -10.5% |
| District of Highlands | 220,027 | 274,687 | 24.8% | 7,776 | 9,373 | 20.5% |
| Juan de Fuca Electoral Area* | 1,992,655 | 1,912,583 | -4.0% | 67,459 | 73,063 | 8.3% |
| City of Langford | 2,590,548 | 3,491,537 | 34.8% | 133,247 | 169,775 | 27.4% |
| District of Metchosin | 514,949 | 506,440 | -1.7% | 16,333 | 9,038 | -44.7% |
| District of North Saanich | 1,318,084 | 1,325,251 | 0.5% | 54,454 | 45,201 | -17.0% |
| District of Oak Bay | 1,654,197 | 1,547,417 | -6.5% | 89,140 | 77,178 | -13.4% |
| District of Saanich | 11,004,052 | 10,308,380 | -6.3% | 574,835 | 496,408 | -13.6% |
| Salt Spring Island Electoral Area* | 608,477 | 633,681 | 4.1% | 45,361 | 43,963 | -3.1% |
| Town of Sidney | 1,229,020 | 1,188,309 | -3.3% | 62,025 | 56,194 | -9.4% |
| District of Sooke | 963,383 | 1,140,991 | 18.4% | 46,616 | 46,574 | -0.1% |
| City of Victoria | 9,830,828 | 9,436,659 | -4.0% | 481,559 | 452,567 | -6.0% |
| Town of View Royal | 959,422 | 998,682 | 4.1% | 48,163 | 45,507 | -5.5% |
| Southern Gulf Islands Electoral Area* | 503,849 | 535,368 | 6.3% | 28,947 | 29,220 | 0.9% |
* Land-use GHG emission estimates have been withheld due to limited land-use data.
18 TOWN OF VIEW ROYAL
18.1 2018 Profile
| Profile Component | Value |
|---|---|
| Population | 11,283 |
| Dwellings | 4,637 |
| Registered Vehicles | 7,268 |
| Energy (Thousands of GJ) | 999 |
| GHG Emissions (tCO2e) | 45,507 |
18.2 Energy & GHG Emissions
Table 22 presents a summary comparison of the Town of View Royal’s 2007 and 2018 energy and GHG emissions.
Table 22. Estimated Energy and GHG Emissions By Reporting Source
| Source | Type | 2007 Energy (GJ) | 2018 Energy (GJ) | Change (%) | 2007 GHG Emissions (tCO2e) | 2018 GHG Emissions (tCO2e) | Change (%) |
|---|---|---|---|---|---|---|---|
| Stationary Energy | |||||||
| Residential Buildings | Electricity | 185,764 | 179,782 | -3.2% | 1,290 | 533 | -58.7% |
| Natural Gas | 75,155 | 76,534 | 1.8% | 3,748 | 3,817 | 1.8% | |
| Fuel Oil | 22,724 | 27,689 | 21.8% | 1,554 | 1,893 | 21.8% | |
| Propane | 3,926 | 3,706 | -5.6% | 239 | 227 | -5.3% | |
| Wood | 8,710 | 8,314 | -4.6% | 205 | 195 | -4.6% | |
| Diesel | 6,462 | 5,842 | -9.6% | 500 | 424 | -15.2% | |
| Commercial & Industrial Buildings | Electricity | 113,772 | 129,927 | 14.2% | 790 | 385 | -51.3% |
| Natural Gas | 123,868 | 146,990 | 18.7% | 6,177 | 7,330 | 18.7% | |
| Fuel Oil | 0 | 0 | - | 0 | 0 | - | |
| Diesel | 11,652 | 12,559 | 7.8% | 901 | 911 | 1.1% | |
| Energy Industries | LFG Combustion | - | 0 | - | 0 | 0 | - |
| Agriculture, Forestry And Fishing Activities | Diesel | 30,825 | 31,438 | 2.0% | 2,384 | 2,281 | -4.3% |
| Natural Gas Fugitive Emissions | - | - | 38 | 60 | 58.1% | ||
| Total Stationary Energy | 582,858 | 622,780 | 6.8% | 17,826 | 18,055 | 1.3% | |
| On-Road Transportation | |||||||
| Electric Vehicles | Electricity | - | 1 | - | - | 2 | - |
| Passenger Vehicles | Gasoline + Diesel + Propane | 138,335 | 138,673 | 0.2% | 9,846 | 8,929 | -9.3% |
| Light Trucks, Vans, SUVs | Gasoline + Diesel + Propane | 141,783 | 182,230 | 28.5% | 10,031 | 11,666 | 16.3% |
| Heavy Duty Vehicles | Gasoline + Diesel + Propane | 54,665 | 12,295 | -77.5% | 3,828 | 785 | -79.5% |
| Motorcycles | Gasoline | 1,223 | 895 | -26.8% | 84 | 62 | -26.8% |
| Total On-Road Transportation | 336,005 | 334,094 | -0.6% | 23,789 | 21,443 | -9.9% | |
| Off-Road Transportation | |||||||
| Marine, Aviation and Other Off-Road Vehicles | Marine Gasoline + Marine Diesel + Jet Fuel | 40,558 | 41,809 | 3.1% | 3,072 | 3,084 | 0.4% |
| Total Off-Road Transportation | 40,558 | 41,809 | 3.1% | 3,072 | 3,084 | 0.4% | |
| Waste | |||||||
| Wastewater | 386 | 475 | 23.1% | ||||
| Composting | 0 | 170 | - | ||||
| Solid Waste | 2,856 | 1,770 | -38.0% | ||||
| Total Waste | 3,242 | 2,416 | -25.5% | ||||
| Agriculture Forestry & Other Land Use (AFOLU) | |||||||
| Land-Use | -1,753 | -3,102 | 76.9% | ||||
| Livestock, Aggregate Sources and Non-CO2 Emission Sources on Land | 2 | 2 | -11.0% | ||||
| Total AFOLU | -1,751 | -3,100 | 77.0% | ||||
| Industrial Process & Product Use (IPPU) | |||||||
| Process Use Emissions | 1,986 | 3,610 | 81.8% | ||||
| Total IPPU | 1,986 | 3,610 | 81.8% | ||||
| TOTAL | 959,422 | 998,682 | 4.1% | 48,163 | 45,507 | -5.5% |
APPENDIX A
Comparison of the District of Saanich’s and the CRD’s GHG calculation of the 2007 and 2017/2018 GHG emissions is presented in Table A1 and Table A2 below. It should be noted that the District of Saanich has not prepared a 2018 GHG emissions inventory and as such, the reported 2017 GHG emissions inventory is used as a proxy for comparison.
Table A1. Comparision of 2007 GHG Emissions Inventories
| Sector | Sub-Sector | 2007 SAANICH GHG (tCO2e) | 2007 CRD GHG (tCO2e) | Difference (tCO2e) | Explanation for Difference |
|---|---|---|---|---|---|
| Stationary Energy | Residential Buildings | 93,458 | 106,201 | 12,743 | ● Due to concerns around the published energy data (see Section 2.3), the raw energy values for electricity and natural gas were used in the CRD inventory. Results in a ~7,500 tCO2e increase. ● ECCC NIR updated 2007 (Original 33,000 tCO2e; Updated 183,000 tCO2e) numbers for other off-road residential emissions. This is a common occurrence for ECCC. They will typically update historical numbers based on new data and methodological changes. Results in an ~5,200 tCO2e increase. |
| Agriculture, Forestry, And Fishing Activities | 13,550 | 29,343 | 15,793 | ● ECCC NIR updated 2007 numbers for this source of GHG emissions (Original 500,000 tCO2e; Updated 873,000 tCO2e). Results in the increase in GHG emissions. | |
| Commercial / Institutional Buildings | 52,835 | 59,777 | 6,942 | ● Due to concerns around the published energy data (see Section 2.3), the raw energy values for electricity and natural gas were used in the CRD inventory. Results in an ~1,000 tCO2e increase. ● ECCC NIR updated 2007 numbers for other off-road commercial and manufacturing emissions. (Original 210,000 tCO2e; Updated 330,000 tCO2e). Results in an ~6,000 tCO2e increase. |
|
| Energy Industries | 418 | 418 | ● 2007 flaring data was not available to Saanich at the time of reporting. | ||
| Fugitive Emissions: Oil and Natural Gas Systems | 1,800 | 314 | (1,486) | ● For the CRD project, FORTISBC provided 2018 fugitive numbers for the CRD which did not include upstream GHG emissions. This value was then prorated to each CRD member based on the number of natural gas connections. The original value in the reported inventory was estimated by FORTISBC for the District and includes upstream emissions. To be consistent in terms of methodology across the CRD, the new value was applied. | |
| Transportation | On-Road Transportation | 88,486 | 105,898 | 17,413 | ● The CRD calculator uses the original 2007 and 2010 vehicle registration data, whereas the original inventory used the published 2012 data (which contained the 2007 and 2010 data which was modified based on changes to the 2012 methodology). During the preparation of the CRD calculator, it was brought to light there are concerns with the 2012 data which impacted the 2007 and 2010 values. As such, the original CEEI 2007 and 2010 data was used in the CRD calculator. The original inventory used the estimated Vehicle Kilometer Travelled (VKT) data and fuel efficiency factors that were used in the BC CEEIs which were derived from AirCare data. As the AirCare data program ended in 2014, the CRD inventory uses VKT data and fuel efficiency factors that are generated and used by Environment Canada (EC) in their calculation of Provincial and Federal GHG emissions. The fuel consumption values, on average, in the EC dataset are higher than those used in the CEEI estimates. Some of the original vehicle registrations were also reclassed to align with the EC dataset. Results in a ~46,000 tCO2e increase. ● BC Transit GHG emissions were allocated based on total service population, rather than the CRD population as was done in the original inventory. Results in an ~6,000 tCO2e decline. |
| Transboundary Transportation | 151,977 | 176,450 | 24,473 | ● See above note. | |
| Off-Road Transportation: Aviation, Waterborne, and Other Off-Road | 14,562 | 37,808 | 23,246 | ● Land and marine based aviation GHG emissions were assigned on a per capita basis. There were some changes to the Provinces population counts between inventories resulting in a decline of aviation emissions by ~1,700 tCO2e ● In the original inventory, the BC Ferries GHG emissions was allocated based on a per capita basis based on total passengers. Since BC Ferries also serves the Vancouver coast population, the methodology was changed and the BC ferries value was prorated based on the Vancouver Island and Vancouver South Coast population in the CRD inventory. Results in an increase of ~10,000 tCO2e. ● ECCC NIR updated 2007 numbers for other off-road emissions. (Original 110,000 tCO2e; Updated 687,000 tCO2e). Results in an ~15,000 tCO2e increase. |
|
| Waste | Waste: Solid Waste Disposal, Biological Treatment of Waste, Wastewater Treatment and Discharge | 34,121 | 40,134 | 6,013 | ● In the original inventory, wastewater volumes were allocated based on a 2015 study whereas the CRD values are based on Total annual volume of wastewater by municipality. Results in an ~500 tCO2e increase. ● The original inventory pro-rated Hartland Landfill GHG emissions based on total volume of waste (estimated by the District) sent to landfill. The CRD inventory assigns 31% of waste emissions to the City of Victoria (which was a lower claim than what was estimated in the original inventory) and assigns the rest of the landfill emissions on a per capita basis. Results in an increase of ~6,500 tCO2e. |
| AFOLU | AFOLU: Livestock, Land, and Other Agriculture | 20,071 | (5,947) | (26,018) | ● For the CRD inventory, the BC MOE provided BC based land-use emissions factors and there was a change in the calculation methodologies based on land-use data at the CRD level. Results in a decrease of GHG emissions by ~15,000 tCO2e. ● The Saanich inventory was also using livestock GHG estimates from the Agriculture and Agri-Food Canada (AAFC) Holos GHG emissions model (V3.1) using 2016 Statistics Canada Agriculture Census Data which conservatively over estimated livestock emissions, but this approach was not used in the CRD estimates as the livestock census data is from 2006 and not complete for all CRD members. As such, in the CRD calculator all livestock and direct/indirect manure and soil GHG estimates are based on the ECCC NIR and prorated based on hectares of agricultural land. Results in a decline of GHG emissions by 11,000 tCO2e. |
| IPPU | IPPU: Industrial Processes, and Product Use | 24,524 | 24,438 | (86) | ● ECCC NIR updated 2007 numbers for IPPU GHG emissions. Results in a decline of ~100 tCO2e. |
| Total GHG Emissions | 495,384 | 574,835 | 79,451 |
Table A2. Comparision of 2017 and 2018 GHG Emissions Inventories
| Sector | Sub-Sector | 2017 SAANICH GHG (tCO2e) | 2018 CRD GHG (tCO2e) | Difference (tCO2e) | Explanation for Difference |
|---|---|---|---|---|---|
| Stationary Energy | Residential Buildings | 89,308 | 85,067 | (4,241) | ● The CRD inventory is using 2018 energy data whereas the Saancih calculator is based on 2017. ● To estimate wood and propane use, the linear regression equation was based on the CRD total consumption and HDD days (instead of the reporter’s consumption) which resulted in immaterial changes to the values. ● ECCC NIR updated 2018 (Original 140,000 tCO2e; Updated 147,000 tCO2e) numbers for other off-road residential emissions. The difference is also due to different reporting years being reported in this table (values are assigned on a per capita basis). |
| Agriculture, Forestry, And Fishing Activities | 13,314 | 24,471 | 11,157 | ● ECCC NIR updated 2018 numbers for this source of GHG emissions (Original 540,000 tCO2e; Updated 791,000 tCO2e). The difference is also due to different reporting years being reported in this table (values are assigned on a per capita basis). | |
| Commercial / Institutional Buildings | 56,819 | 55,514 | (1,305) | ● ECCC NIR updated 2018 numbers for other off-road commercial and manufacturing emissions. (Original 290,000 tCO2e; Updated 316,000 tCO2e). The difference is also due to different reporting years being reported in this table (values are assigned on a per capita basis). | |
| Energy Industries | 7,658 | 7,658 | ● Flaring data was not available to Saanich at the time of reporting. | ||
| Fugitive Emissions: Oil and Natural Gas Systems | 1,206 | 432 | (774) | ● For the CRD project, FORTISBC provided 2018 fugitive numbers for the CRD which did not include upstream GHG emissions. This value was then prorated to each CRD member based on the number of natural gas connections. The original value in the reported inventory was estimated by FORTISBC for the District and included upstream emissions. To be consistent in terms of methodology across the CRD, the new value was applied. | |
| Transportation | On-Road Transportation | 102,580 | 98,176 | (4,404) | ● The CRD calculator uses the original 2007 and 2010 vehicle registration data, whereas the original inventory used the published 2012 data (which contained the 2007 and 2010 data which was modified based on changes to the 2012 methodology). During the preparation of the CRD calculator, it was brought to light there are concerns with the 2012 data which impacted the 2007 and 2010 values. As such, the original CEEI 2007 and 2010 data was used in the CRD calculator. In the original inventory, transportation GHG emissions were estimated based on population growth and the number of registered vehicles in 2012 whereas the CRD inventory uses 2010 vehicle registration data. The original inventory used the estimated Vehicle Kilometer Travelled (VKT) data and fuel efficiency factors that were used in the BC CEEIs which were derived from AirCare data. As the AirCare data program ended in 2014, the CRD inventory uses VKT data and fuel efficiency factors that are generated and used by Environment Canada (EC) in their calculation of Provincial and Federal GHG emissions. The fuel consumption and VKT values, on average, in the EC dataset are lower than those used in the GHG calculator. Results in a ~15,300 tCO2e decline in GHG emissions. ● BC Transit GHG emissions were allocated based on total service population, rather than the CRD population as was done in the original inventory. Results in an ~6,700 tCO2e decline. |
| Transboundary Transportation | 169,961 | 152,356 | (17,605) | ● See above comment. | |
| Off-Road Transportation: Aviation, Waterborne, and Other Off-Road | 26,273 | 33,085 | 6,812 | ● Airport GHG emissions were assigned on a per capita basis. There were some changes to the Provinces population counts between inventories resulting in a decline of aviation emissions by ~200 tCO2e ● In the original inventory, the BC Ferries GHG emissions was allocated based on a per capita basis based on total passengers. Since BC Ferries also serves the Vancouver coast population, the methodology was changed and the BC ferries value was prorated based on the Vancouver Island and Vancouver South Coast population in the CRD inventory. Results in an increase of ~8,000 tCO2e. ● ECCC NIR updated 2018 numbers for other off-road emissions. (Original 750,000 tCO2e; Updated 682,000 tCO2e). Results in an ~2,000 tCO2e decline. The difference is also due to different reporting years being reported in this table (values are assigned on a per capita basis). |
|
| Waste | Waste: Solid Waste Disposal, Biological Treatment of Waste, Wastewater Treatment and Discharge | 23,819 | 28,252 | 4,433 | ● In the original inventory, wastewater volumes were allocated based on a 2015 study whereas the CRD values are based on Total annual volume of wastewater by municipality. Results in an ~100 tCO2e decline. ● The original inventory pro-rated Hartland Landfill GHG emissions based on total volume of waste (estimated by the District) sent to landfill. The CRD inventory assigns 31% of waste emissions to the City of Victoria (which was a lower claim than what was estimated in the original inventory) and assigns the rest of the landfill emissions on a per capita basis. Results in an increase of ~4,400 tCO2e. |
| AFOLU | AFOLU: Livestock, Land, and Other Agriculture | (10,257) | (27,332) | (17,075) | ● For the CRD inventory, the BC MOE provided BC based land-use emissions factors and there was a change in the calculation methodologies based on land-use data at the CRD level. Results in a decrease of GHG emissions by ~7,000 tCO2e. ● The Saanich inventory was also using livestock GHG estimates from the Agriculture and Agri-Food Canada (AAFC) Holos GHG emissions model (V3.1) using 2016 Statistics Canada Agriculture Census Data which conservatively over estimated livestock emissions, but this approach was not used in the CRD estimates as the livestock census data is from 2006 and not complete for all CRD members. As such, in the CRD calculator all livestock and direct/indirect manure and soil GHG estimates are based on the ECCC NIR and prorated based on hectares of agricultural land. Results in a decline of GHG emissions by 10,000 tCO2e |
| IPPU | IPPU: Industrial Processes, and Product Use | 39,883 | 38,729 | (1,155) | ● IPPU is allocated on a per capita basis. The difference is due to different reporting years being reported in this table. |
| Total GHG Emissions | 512,906 | 496,408 | -16,498 |
APPENDIX B
Comparison of the City of Victoria’s and the CRD’s GHG calculation of the 2007 and /2018 GHG emissions is presented in Table B1 and Table B2 below.
Table B1. Comparision of 2007 GHG Emissions Inventories
| Sector | Sub-Sector | 2007 VICTORIA GHG (tCO2e) | 2007 CRD GHG (tCO2e) | Difference | Explanation for Difference |
|---|---|---|---|---|---|
| Stationary Energy | Residential Buildings | 84,187 | 116,072 | 31,885 | ● Due to concerns around the published energy data (see Section 2.3), the raw energy values for electricity and natural gas were used in the CRD inventory. Results in a ~28,000 tCO2e increase. This effect is nearly netted out with the decrease in commercial building natural gas consumption (see below). ● ECCC NIR updated 2007 (Original 33,000 tCO2e; Updated 183,000 tCO2e) numbers for other off-road residential emissions. This is a common occurrence for ECCC. They will typically update historical numbers based on new data and methodological changes. Results in a ~3,800 tCO2e increase. |
| Commercial / Institutional Buildings | 120,528 | 98,912 | -21,616 | ● Due to concerns around the published energy data (see Section 2.3), the raw energy values for electricity and natural gas were used in the CRD inventory. Results in a ~25,000 tCO2e decline. This effect is nearly netted out with the increase in residential building natural gas consumption (see above). ● ECCC NIR updated 2007 numbers for other off-road commercial and manufacturing emissions. (Original 210,000 tCO2e; Updated 330,000 tCO2e). Results in an ~4,000 tCO2e increase. |
|
| Fugitive Emissions: Oil and Natural Gas Systems | 1,370 | 231 | -1,139 | ● For the CRD project, FORTISBC provided 2018 fugitive numbers for the CRD which did not include upstream GHG emissions. This value was then prorated to each CRD member based on the number of natural gas connections. The original value in the reported inventory was estimated by FORTISBC for the City and includes upstream emissions. To be consistent in terms of methodology across the CRD, the new value was applied. | |
| Transportation | On-Road Transportation | 40,274 | 50,420 | 10,146 | ● The CRD calculator uses the original 2007 and 2010 vehicle registration data, whereas the original inventory used the published 2012 data (which contained the 2007 and 2010 data which was modified based on changes to the 2012 methodology). During the preparation of the CRD calculator, it was brought to light there are concerns with the 2012 data which impacted the 2007 and 2010 values. As such, the original CEEI 2007 and 2010 data was used in the CRD calculator. In the original inventory, transportation GHG emissions were estimated based on population growth and the number of registered vehicles in 2012. The original inventory used the estimated Vehicle Kilometer Travelled (VKT) data and fuel efficiency factors that were used in the BC CEEIs which were derived from AirCare data. As the AirCare data program ended in 2014, the CRD inventory uses VKT data and fuel efficiency factors that are generated and used by Environment Canada (EC) in their calculation of Provincial and Federal GHG emissions. The fuel consumption values, on average, in the EC dataset are higher than those used in the original inventory calculator. Results in a ~41,500 tCO2e increase in GHG emissions. ● BC Transit GHG emissions were allocated based on total service population, rather than the CRD population as was done in the original inventory. Results in an ~4,700 tCO2e decline. |
| Transboundary Transportation | 100,290 | 126,935 | 26,645 | ● See above note. | |
| Off-Road Transportation: Aviation, Waterborne, and Other Off-Road | 56,959 | 38,042 | -18,917 | ● Land and marine based aviation GHG emissions were assigned on a per capita basis. There were some changes to the Provinces population counts between inventories resulting in a decline of aviation emissions. ● There was also a methodology change in the assignment in marine aviation GHG emissions. The GPC Protocol provided updated guidance on the assignment of aviation emissions allowing these to be assigned as Scope 3 GHG emissions regardless of the location of the airport(s). On this basis, all marine aviation emissions were assigned on a per capita basis to all municipalities. This resulted in a decline of ~8,000 tCO2e. ● In the original inventory, the BC Ferries GHG emissions were allocated based on a per capita basis for Vancouver Island. Since BC Ferries also serves the Vancouver coast population, the methodology was changed and the BC ferries value was prorated based on the Vancouver Island and Vancouver South Coast population in the CRD inventory. Results in a decline of ~23,000 tCO2e ● The CRD inventory includes an estimate of ~7,000 tCO2e of cruise ship emissions not included in the original inventory. ● ECCC NIR updated 2007 numbers for other off-road emissions. (Original 110,000 tCO2e; Updated 687,000 tCO2e). Results in an ~10,000 tCO2e increase. |
|
| Waste | Waste: Solid Waste Disposal, Biological Treatment of Waste, Wastewater Treatment and Discharge | 58,072 | 33,367 | -24,705 | ● In the original inventory, wastewater volumes were allocated based on a 2015 study whereas the CRD values are based on Total annual volume of wastewater by municipality. Results in an ~600 tCO2e increase. ● The original inventory pro-rated Hartland Landfill GHG emissions based on total volume of waste (estimated by the City) sent to landfill. The CRD inventory assigns 31% of waste emissions to the City of Victoria. Results in a decrease of ~23,000 tCO2e. ● The CRD inventory does not include Tervia Landfill GHG emissions (2,800 tCO2e not accounted for). |
| AFOLU | AFOLU: Livestock, Land, and Other Agriculture | 822 | -217 | -1,039 | ● For the CRD inventory, the BC MOE provided BC based land-use emissions factors and there was a change in the calculation methodologies based on land-use data at the CRD level. Results in a decrease of GHG emissions by ~1,000 tCO2e. |
| IPPU | IPPU: Industrial Processes, and Product Use | 17,859 | 17,798 | -61 | ● IPPU is allocated on a per capita basis. The difference is due to different reporting years being reported in this table. |
| Total GHG Emissions | 480,361 | 481,559 | 1,198 |
Table B2. Comparision of 2018 GHG Emissions Inventories
| Sector | Sub-Sector | 2018 VICTORIA GHG (tCO2e) | 2018 CRD GHG (tCO2e) | Difference (tCO2e) | Explanation for Difference |
|---|---|---|---|---|---|
| Stationary Energy | Residential Buildings | 66,576 | 70,618 | 4,042 | ● ECCC NIR updated 2018 (Original 140,000 tCO2e; Updated 147,000 tCO2e) numbers for other off-road residential emissions. Results in the increase in GHG emissions. |
| Commercial / Institutional Buildings | 118,206 | 120,491 | 2,285 | ● ECCC NIR updated 2018 numbers for this source of GHG emissions (Original 540,000 tCO2e; Updated 791,000 tCO2e). Results in the increase in GHG emissions. | |
| Fugitive Emissions: Oil and Natural Gas Systems | 1,200 | 370 | -830 | ● For the CRD project, FORTISBC provided 2018 fugitive numbers for the CRD which did not include upstream GHG emissions. This value was then prorated to each CRD member based on the number of natural gas connections. The original value in the reported inventory was estimated by FORTISBC for the City and includes upstream emissions. To be consistent in terms of methodology across the CRD, the new value was applied. | |
| Transportation | On-Road Transportation | 42,580 | 47,383 | 4,803 | ● The CRD calculator uses the original 2007 and 2010 vehicle registration data, whereas the original inventory used the published 2012 data (which contained the 2007 and 2010 data which was modified based on changes to the 2012 methodology). During the preparation of the CRD calculator, it was brought to light there are concerns with the 2012 data which impacted the 2007 and 2010 values. As such, the original CEEI 2007 and 2010 data was used in the CRD calculator. In the original inventory, transportation GHG emissions were estimated based on population growth and the number of registered vehicles in 2012 whereas the CRD inventory uses 2010 vehicle registration data. The original inventory used the estimated Vehicle Kilometer Travelled (VKT) data and fuel efficiency factors that were used in the BC CEEIs which were derived from AirCare data. As the AirCare data program ended in 2014, the CRD inventory uses VKT data and fuel efficiency factors that are generated and used by Environment Canada (EC) in their calculation of Provincial and Federal GHG emissions. Results in a ~8,500 tCO2e increase in GHG emissions. ● BC Transit GHG emissions were allocated based on total service population, rather than the CRD population as was done in the original inventory. Results in an ~5,000 tCO2e decline. |
| Transboundary Transportation | 106,745 | 115,881 | 9,136 | ● See above note. | |
| Off-Road Transportation: Aviation, Waterborne, and Other Off-Road | 57,732 | 40,436 | -17,296 | ● Land and marine based aviation GHG emissions were assigned on a per capita basis. There were some changes to the Provinces population counts between inventories resulting in a decline of aviation emissions. There was also a methodology change in the assignment in marine aviation GHG emissions. The GPC Protocol provided updated guidance on the assignment of aviation emissions allowing these to be assigned as Scope 3 GHG emissions regardless of the location of the airport(s). On this basis, all marine aviation emissions were assigned on a per capita basis to all municipalities. This resulted in a decline of ~2,500 tCO2e. ● In the original inventory, the BC Ferries GHG emissions were allocated based on a per capita basis for Vancouver Island. Since BC Ferries also serves the Vancouver coast population, the methodology was changed and the BC ferries value was prorated based on the Vancouver Island and Vancouver South Coast population in the CRD inventory. Results in a decline of ~27,500 tCO2e. ● The GVHA reported on cruise ship emissions which increased the City’s GHG emissions by ~11,600 tCO2e. ● ECCC NIR updated 2018 numbers for other off-road emissions. (Original 750,000 tCO2e; Updated 682,000 tCO2e). A slightly higher population value (produced by the Province was used which results in an ~1,200 tCO2e increase. |
|
| Waste | Waste: Solid Waste Disposal, Biological Treatment of Waste, Wastewater Treatment and Discharge | 31,078 | 29,957 | -1,121 | ● In the original inventory, wastewater volumes were allocated based on a 2015 study whereas the CRD values are based on Total annual volume of wastewater by municipality. Results in an ~600 tCO2e increase. ● The original inventory pro-rated Hartland Landfill GHG emissions based on total volume of waste (estimated by the City) sent to landfill. The CRD inventory assigns 31% of waste emissions to the City of Victoria. Results in a decrease of ~1,700 tCO2e. |
| AFOLU | AFOLU: Livestock, Land, and Other Agriculture | -548 | -2,224 | -1,676 | ● For the CRD inventory, the BC MOE provided BC based land-use emissions factors and there was a change in the calculation methodologies based on land-use data at the CRD level. Results in a decrease of GHG emissions by ~1,700 tCO2e. |
| IPPU | IPPU: Industrial Processes, and Product Use | 29,919 | 29,654 | -265 | ● ECCC NIR updated 2018 numbers for IPPU GHG emissions. Results in a decline of ~300 tCO2e. |
| Total GHG Emissions | 453,488 | 452,567 | -921 |