A presentation deck providing an overview of the Community Climate Action Strategy, including purpose, engagement results, current emissions data, and implementation 'Big Moves'.
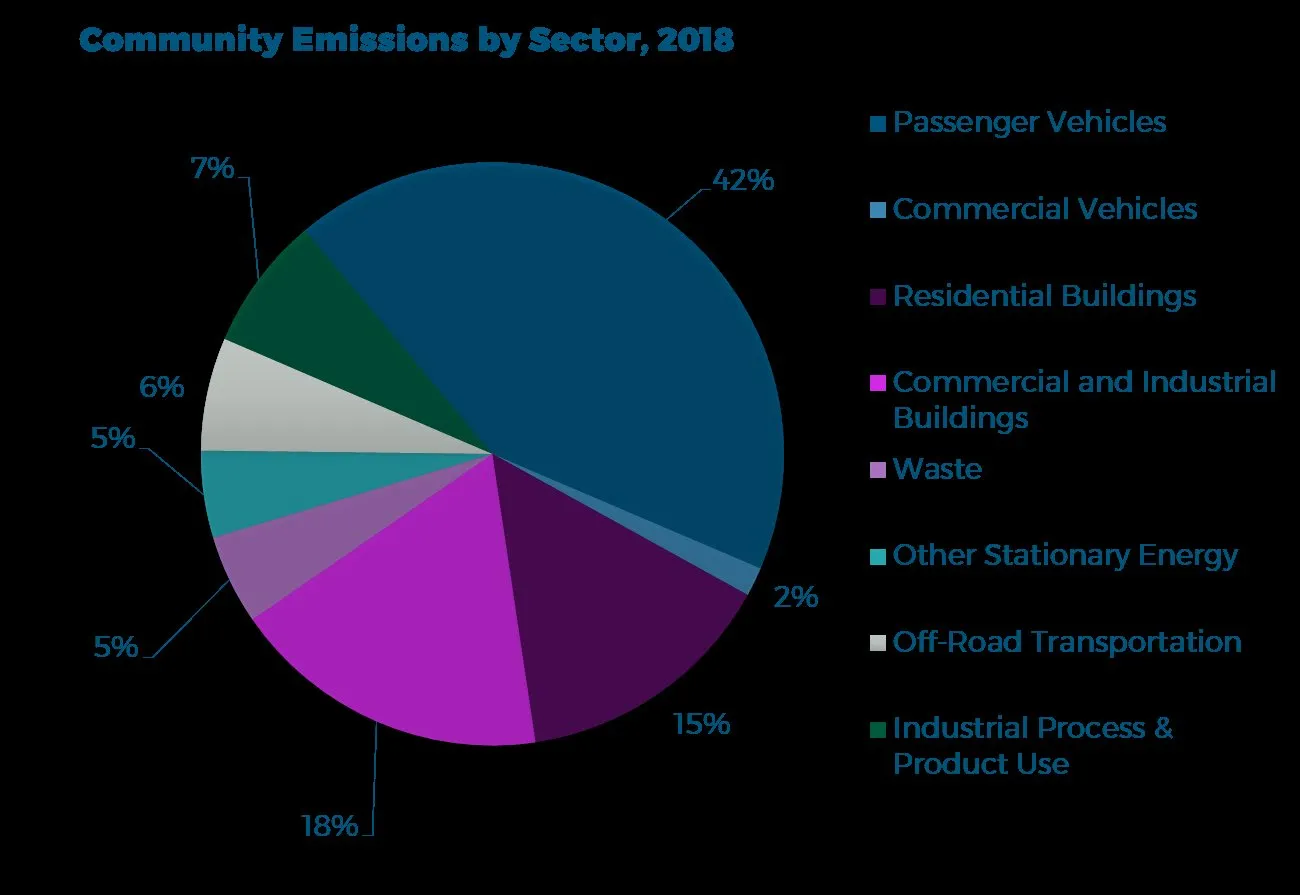
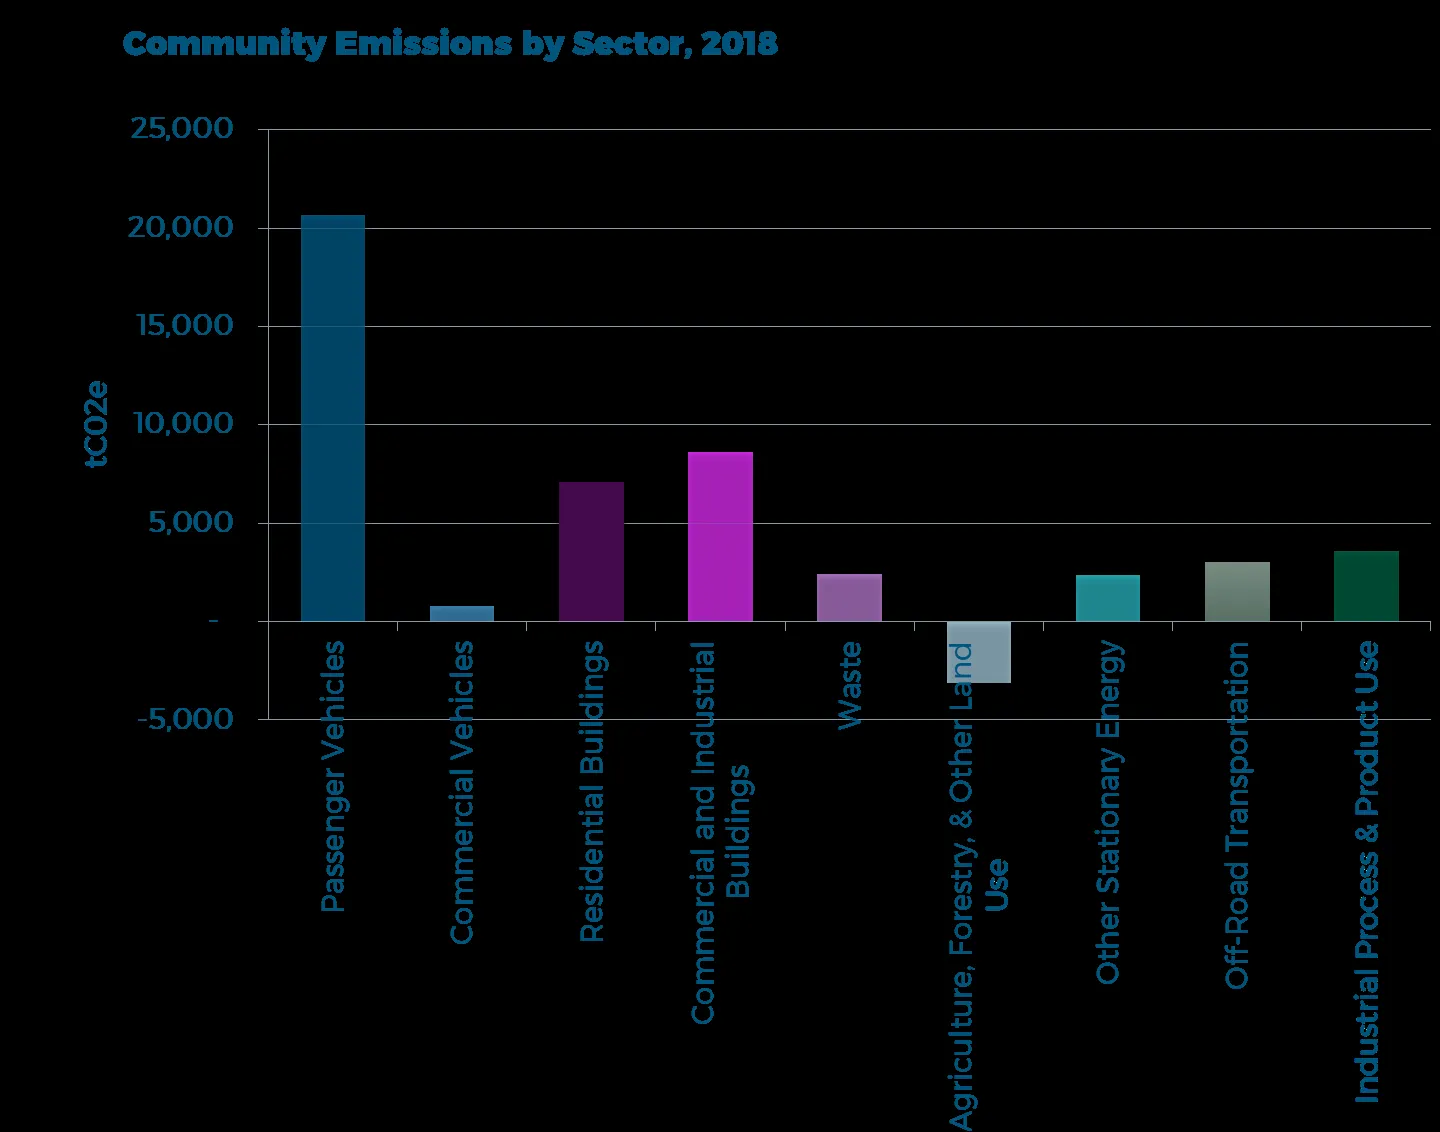
Passenger Vehicles account for 42% of 2018 community emissionsResidential Buildings account for 18% of 2018 community emissionsIdentifies 'Big Moves' in Transportation, Buildings, and WasteImplementation framework includes short, medium, and long-term timeframesPlan renewal planned for every five years
Community Climate Action Strategy
Committee of the Whole – February 8, 2022
PURPOSE:
To introduce the Draft Community Climate Action Strategy for comment
OUTLINE:
Background
Draft Community Climate Action Strategy
Council referrals to Strategy process
Next steps
Page 225–247
1. BACKGROUND
Purpose of Strategy:
Forecast community Green House Gas emissions
Set emissions reduction targets
Develop a plan to meet the targets while working towards carbon neutrality
Increase community awareness and encourage action by individuals to reduce community emissions (online resource guide)
Establish strategies for regular monitoring and progress reporting
Community emissions are territorial (local), not consumption-based, i.e. emissions generated elsewhere in the production of food and other goods.
Public engagement summary of workshops and community survey was presented at the December 14 Committee of the Whole meeting
Emissions targets set at January 18 Council meeting:
45% from 2007 levels by 2030; and
100% from 2007 levels by 2050.
Page 225–247
Town of View Royal Community Climate Action Strategy
View Royal - Committee of the Whole
Feb 8, 2022
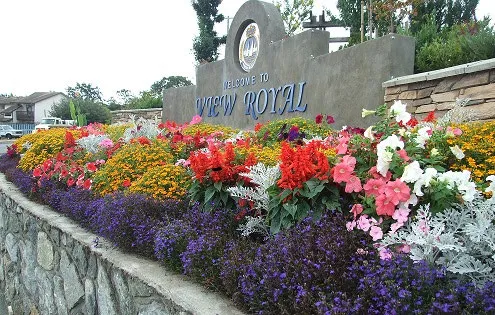
Photograph of the 'Welcome to View Royal' sign surrounded by colorful flowers
Page 225–247
Overview of the Project
The Town of View Royal Community Climate Action Strategy (CCAS) outlines a path towards a low carbon future.
Engagement
Current Emissions
Targets
Implementation Strategy – The Big Moves
Implementation for Success
Page 225–247
Community Climate Action Strategy
A plan to: Leverage local government powers to save residents and businesses energy, emissions, and money
One part of broader local government climate action:
Corporate Energy and Emissions Plan
Adaptation Plan
Focused on mitigation, with a slant on adaptation
Page 225–247
Engagement
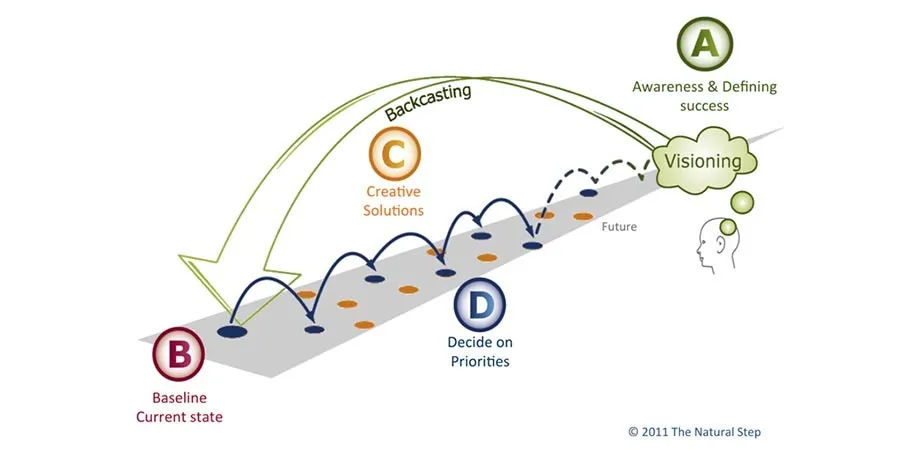
Diagram illustrating the concept of backcasting from a future vision (A) to the current state baseline (B)
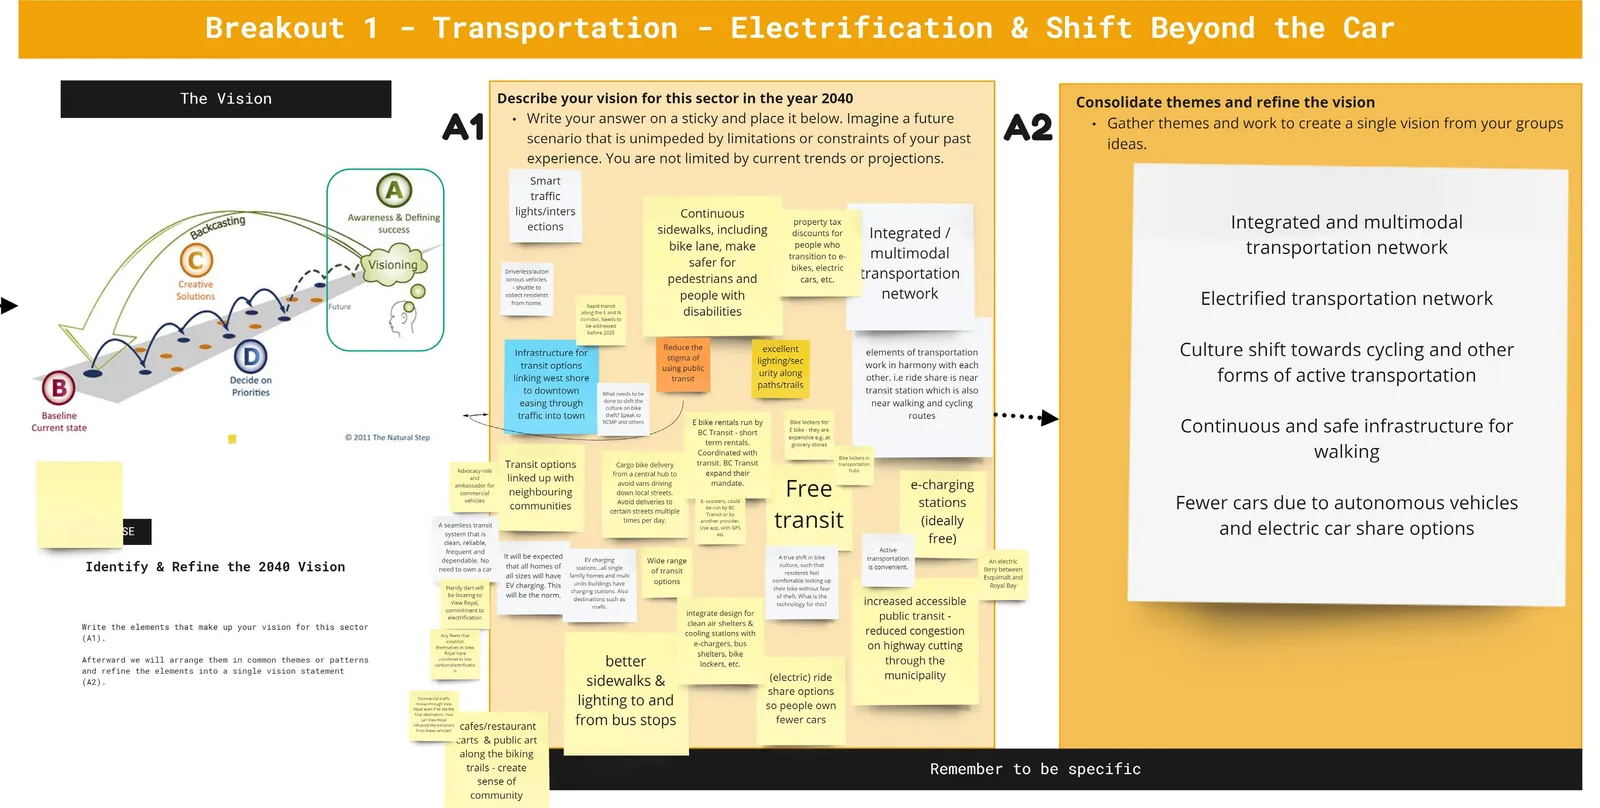
Breakout 1 – Transportation – Electrification & Shift Beyond the Car
Workshop board for Transportation Breakout 1 containing participant-generated ideas and consolidated themes for an integrated multimodal transportation network
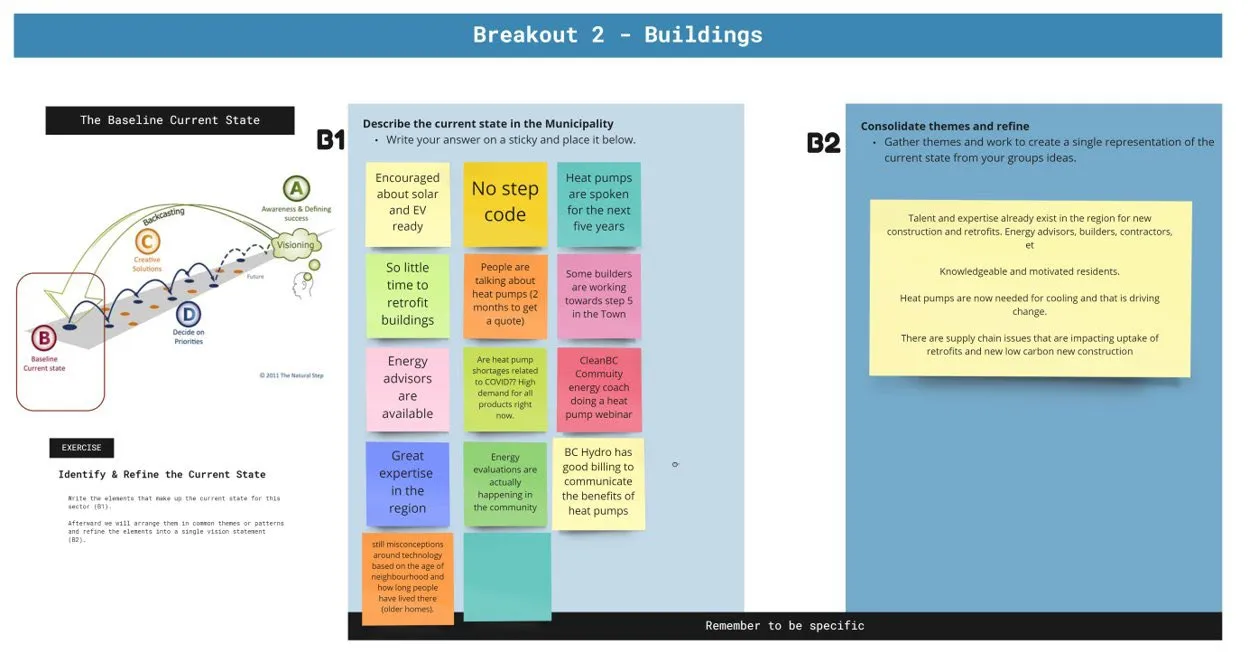
Breakout 2 – Buildings
Workshop board for Buildings Breakout 2 showing current state assessments and consolidated themes regarding regional expertise and heat pump adoption
Page 225–247
Current Emissions
Pie chart of Community Emissions by Sector for 2018, with Passenger Vehicles accounting for 42%Bar chart showing Community Emissions by Sector for 2018 in tCO2e, highlighting Passenger Vehicles as the largest source
Page 225–247
Targets
Icon of a dart hitting a bullseye
45% reduction in emissions below 2007 levels by 2030
100% reduction in emissions below 2007 levels by 2050
These were the targets chosen by Council and affirmed by workshop participants and confirmed in the public survey.
Page 225–247
Implementation
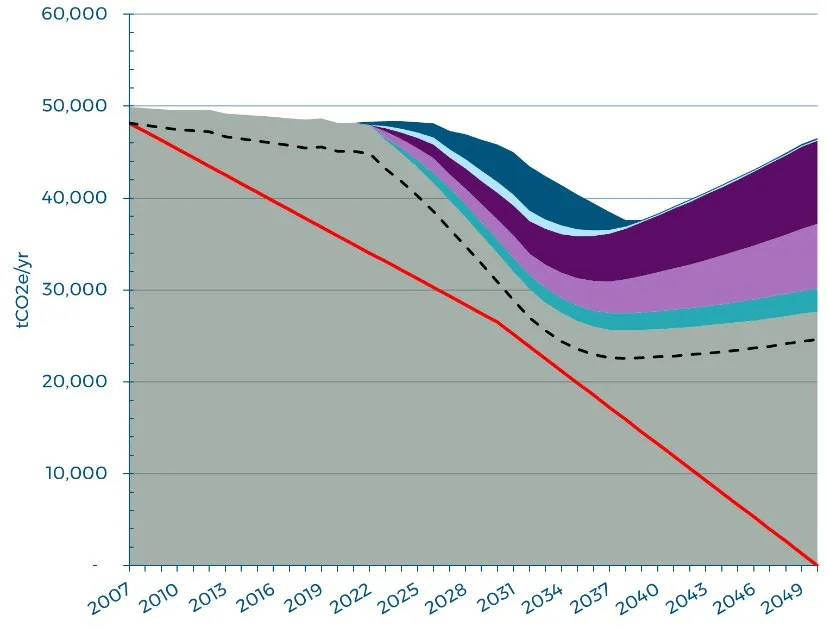
Stacked area chart showing projected community greenhouse gas emissions reductions from 2007 to 2050 based on various action strategies
Emissions reductions over time
By 2030, the majority of emissions savings will be from actions to electrify transportation.
By 2040 and 2050, actions to reduce emissions from community buildings will have a big impact on reaching targets.
Remaining emissions
Tackling remaining emissions between 2040 and 2050 will come from:
Added support at a provincial and federal level.
Technological improvements.
By implementing Big Moves ensure we are well positioned to take advantage of emerging technology.
Page 225–247
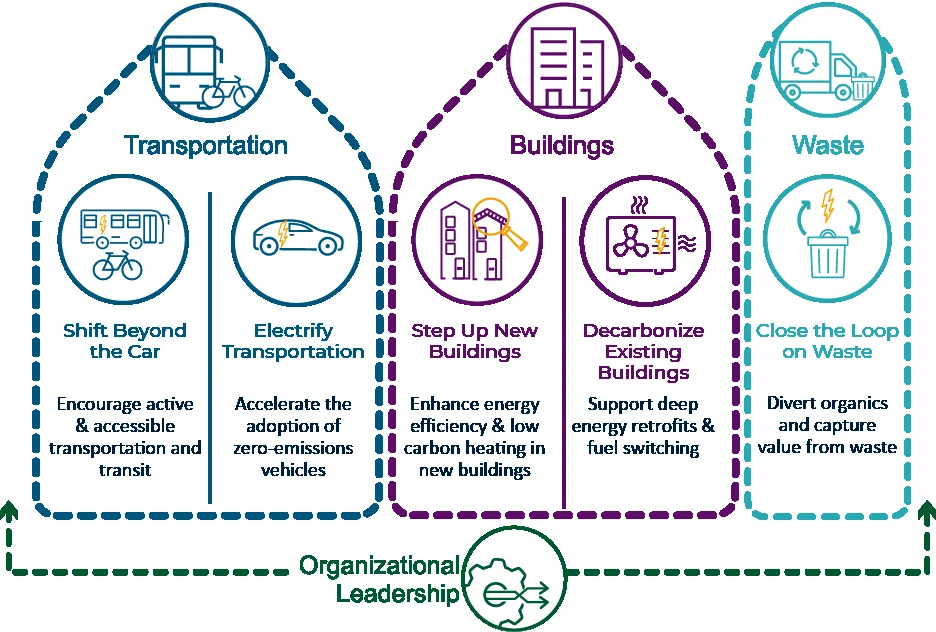
The Big Moves
Implementation Strategies
Infographic of 'The Big Moves' implementation strategies covering Transportation, Buildings, Waste, and Organizational Leadership
Transportation
2050 Vision
A complete zero-emission transportation system connects our communities with the region.
Icon representing public transit and cycling Normalize cycling and pedestrian first streets
Collaborate with CRD on regional EV charging station network
Buildings
2050 Vision
Our community’s buildings are exceptionally energy efficient and powered, heated, and cooled with 100% renewable energy.
*
Continue to top-up CleanBC heat pump incentives
Adopt Step Code with a low carbon approach
Close the Loop on Waste
2050 Vision
Our community diverts 95+% of its organics from landfill.
Expand organics pick-up to multi-unit residential buildings
Page 225–247
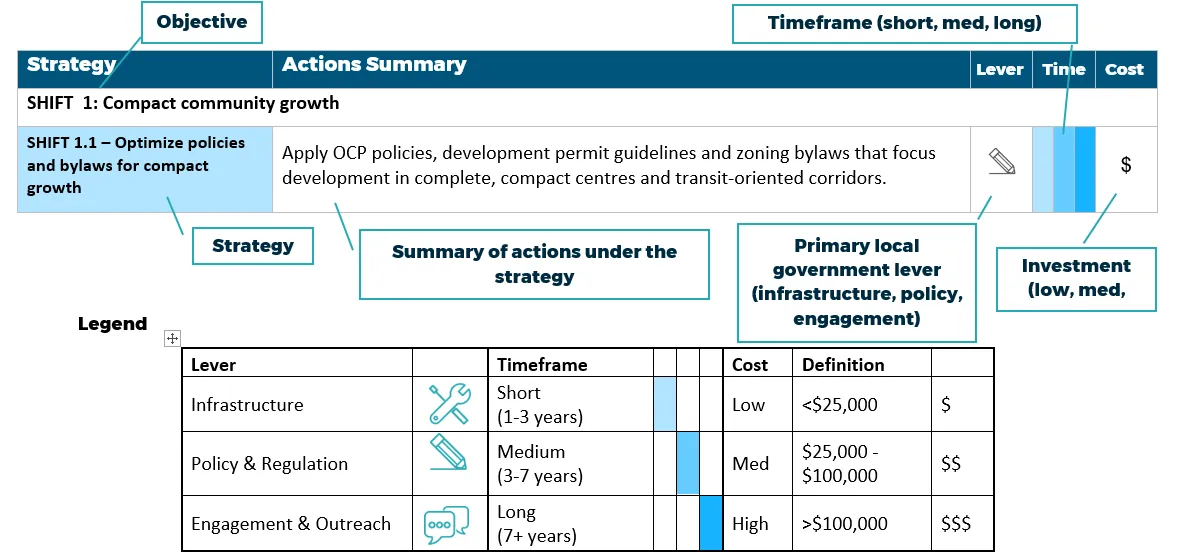
Implementation Framework
Strategy
Actions Summary
Lever
Time
Cost
SHIFT 1: Compact community growth
SHIFT 1.1 – Optimize policies and bylaws for compact growth
Apply OCP policies, development permit guidelines and zoning bylaws that focus development in complete, compact centres and transit-oriented corridors.
Pencil icon
Medium bar
$
Legend
Table showing the Implementation Framework legend with local government levers, timeframe, and cost definitions
Lever
Timeframe
Cost
Definition
Infrastructure (Wrench icon)
Short (1-3 years)
Low
<$25,000 ($)
Policy & Regulation (Pencil icon)
Medium (3-7 years)
Med
$25,000 - $100,000 ($$)
Engagement & Outreach (Chat bubbles icon)
Long (7+ years)
High
>$100,000 ($$$)
Page 225–247
Resiliency Considerations
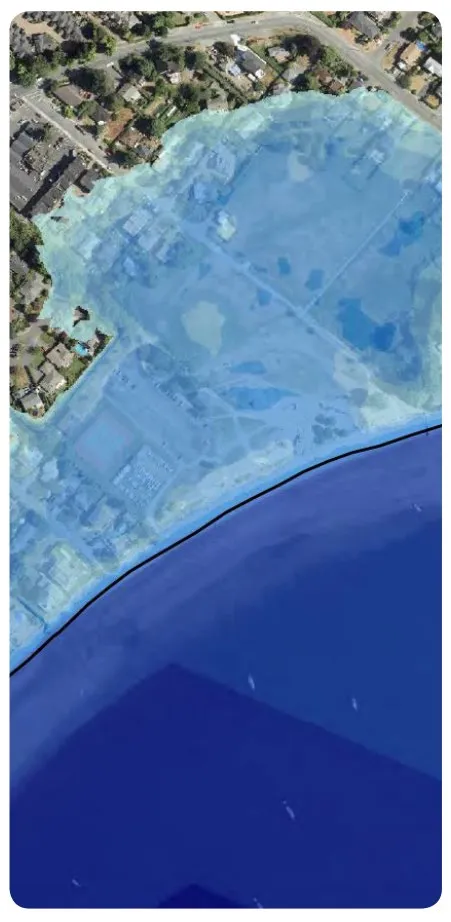
Aerial map of View Royal showing projected sea level rise and storm surge impacts in light blue shading
Expected Climate Impacts and Risks for View Royal
Year-round temperatures will rise, + severe heat event likelihood
Dry spells in the summer will extend
Forest fire risks will increase
Food security risks
Storm activity will become more frequent and intense, with higher winds and more precipitation falling during storm events
Sea levels will rise and will be subject to larger storm surge and wave effects, further increasing the risks of sea level rise
Page 225–247
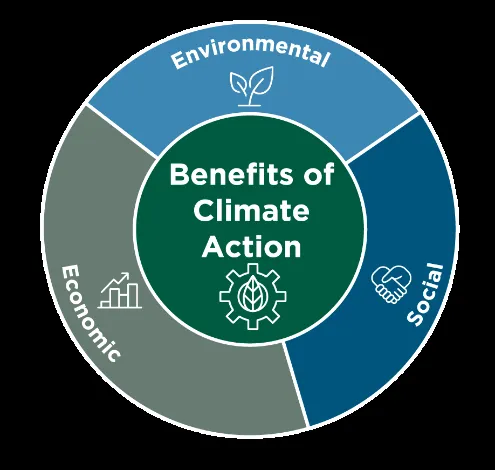
Benefits of Climate Action
Circular 'Benefits of Climate Action' diagram showing environmental, social, and economic co-benefits
View Royal CCAS:
Legislative requirement for GHG targets
Climate Action Charter
Funding
Benefits of implementing:
Environmental: Natural Systems Restoration, Enhanced Green Spaces, Increased Tree Cover
Social: Health & Air Quality, Increased Livability, Social Equity, Improved Resilience, Support Aging in Place
Economic: Energy Resilience & Affordability, Sustainable Asset Management, Economic Development & Job Creation, Recirculate Savings in Local Economy
Page 225–247
Implementation for Success
Category
Description
Incorporate
Embed climate action into other planning documents such as the OCP, bylaws and policies, Council’s strategic plan, Council reports.
Budget
Embed climate action into the budgeting process.
Monitor
Monitor indicators as outlined in the Monitoring and Evaluation section.
Network & Convene
Network with leaders in the climate action sector.
Report
Report regularly to Council on progress and accomplishments.
Renew
Prepare for plan renewal approximately every five years.
Page 225–247
Invitations
Staff networks – electric vehicles, retrofits, Step Code