Staff Report
2022 Building Report August
November 8, 2022Page 271 section
Building permit activity summary for August 2022.
August 2022$15,333,274.00 total construction value for the month$117,931.00 total permit fees for the month72 total YTD permits
2022 Building Report - August
Single Family
| Constr. Value | Permit Fee | # of Permits | |
|---|---|---|---|
| New Construction | |||
| Suite | |||
| Addition | |||
| Renovation Interior | |||
| Renovation Exterior | |||
| Accessory Building | |||
| Total | $0.00 | $0.00 | 0 |
Multi-Family
| Constr. Value | Permit Fee | # of Permits | |
|---|---|---|---|
| New Construction | $14,833,274.00 | $112,243.00 | 1 |
| Addition | |||
| Renovation - Interior | |||
| Renovation Exterior | |||
| Accessory Building | |||
| Total | $14,833,274.00 | $112,243.00 | 1 |
Public Facilities
| Constr. Value | Permit Fee | # of Permits | |
|---|---|---|---|
| New Construction | $500,000.00 | $5,238.00 | 1 |
| Renovation | |||
| Addition | |||
| Total | $500,000.00 | $5,238.00 | 1 |
Commercial
| Constr. Value | Permit Fee | # of Permits | |
|---|---|---|---|
| New Construction | |||
| Renovation - Interior | |||
| Renovation - Exterior | |||
| Total | $0.00 | $0.00 | 0 |
Demolition
| Constr. Value | Permit Fee | # of Permits | |
|---|---|---|---|
| Single Family Dwelling | $300.00 | 3 | |
| Accessory Building | $50.00 | 1 | |
| Deck | |||
| Multifamily | $100.00 | 1 | |
| Total | $450.00 | 5 |
Renewals
| Permit Fee | # of Permits | |
|---|---|---|
| Total |
Month Totals
| Constr. Value | Permit Fee | # of Permits | |
|---|---|---|---|
| Building Only | $15,333,274.00 | $117,931.00 | 7 |
Plumbing
| Permit Fee | # of Permits | |
|---|---|---|
| Residential | $525.00 | 4 |
| Commercial | $825.00 | 4 |
| Total | $1,350.00 | 8 |
Year-to Date Totals
| Constr. Value | Permit Fee | # of Permits | |
|---|---|---|---|
| (Building & Plumbing) | $34,602,471.00 | $292,002.50 | 72 |
Monthly Permit Type Comparison
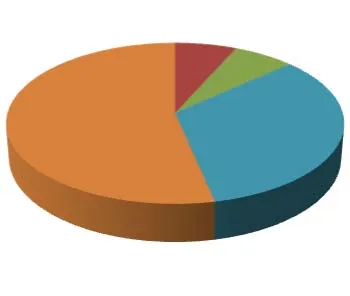
3 Year Comparison - Permit Revenue
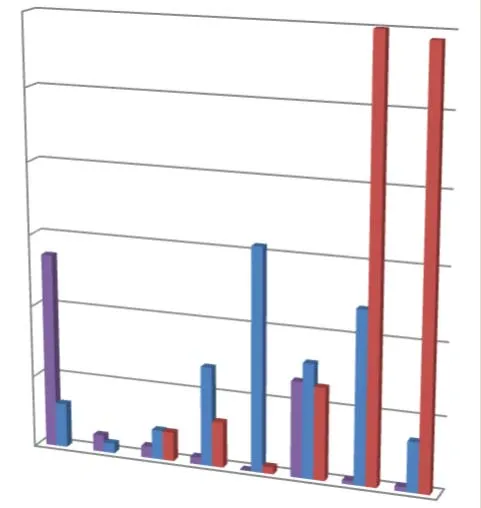
Permit Revenue
[Chart: Horizontal bar chart showing annual Permit Revenue from 2015 to 2022, with a scale from 0.00 to 600,000.00.]
Page 27
Extracted from: 2022 11 08 Committee of the Whole Agenda - Agenda - Pdf