Appendix
Schedule A – Consolidated Budget Variance
January 11, 2022Page 252 sections
A table showing actual vs. budgeted revenue and expenses by department for the year 2021.
2021 YTD Revenue Total: $18,916,1252021 YTD Expense Total: $17,843,903General government services 2021 YTD: $2,432,932
Report to Committee of the Whole
Re: Budget Variance and Projects Update Report to December 31, 2021
Meeting Date: January 11, 2022
Page 25
Schedule A – Consolidated Budget Variance
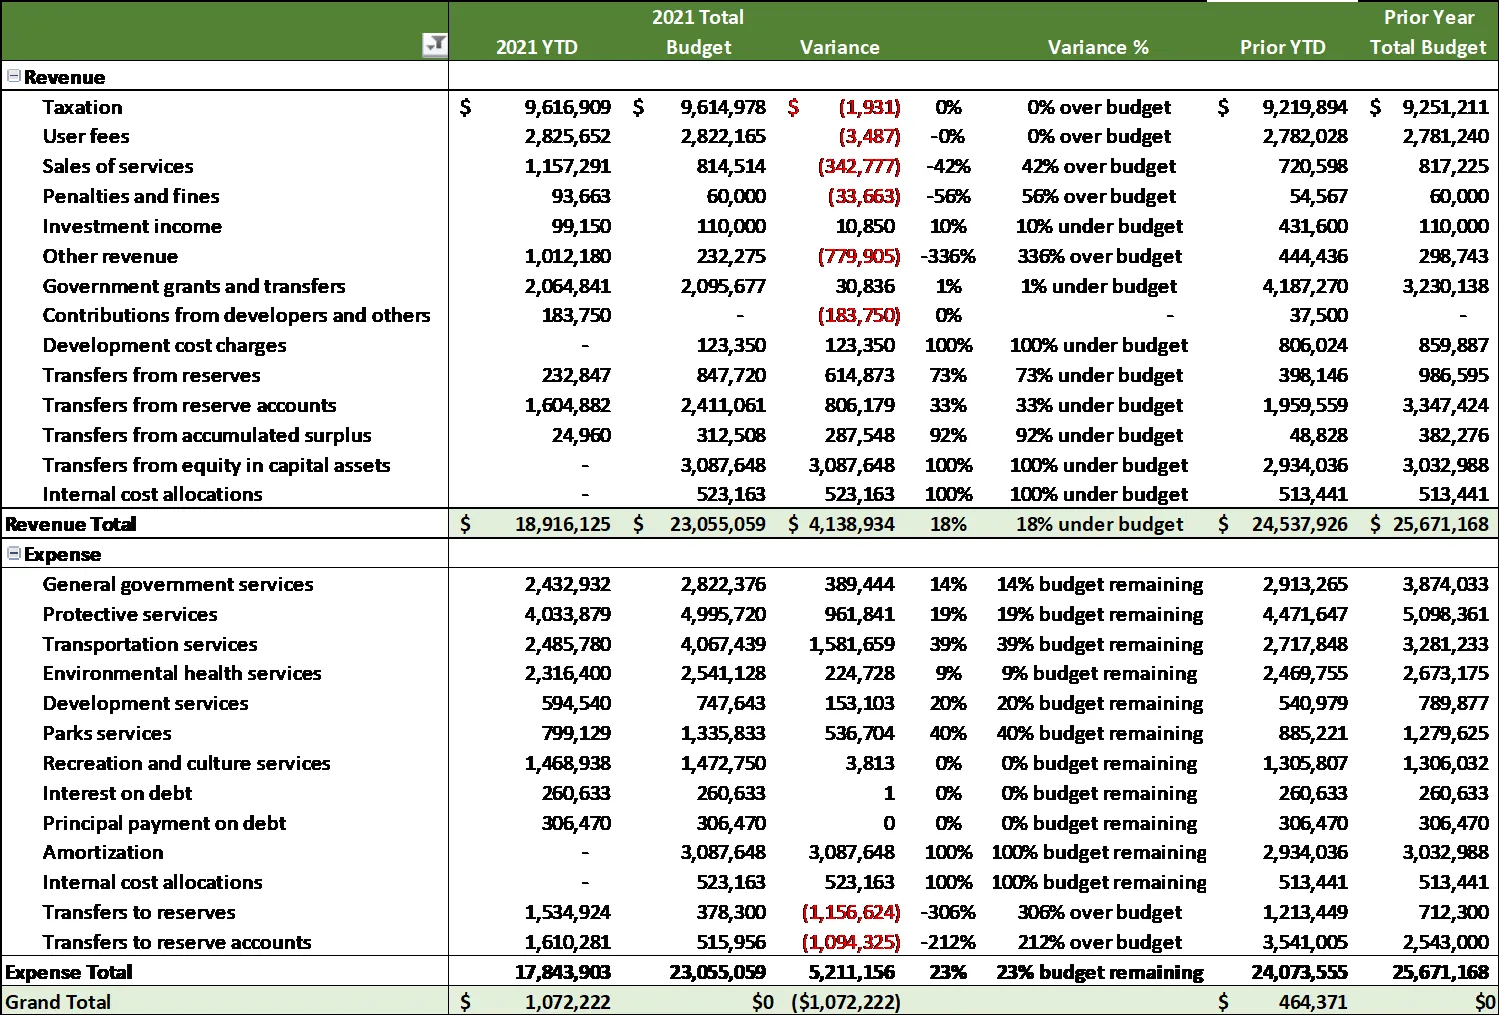
| Revenue | 2021 YTD | 2021 Total Budget | Variance | Variance % | Variance Status | Prior YTD | Prior Year Total Budget |
|---|---|---|---|---|---|---|---|
| Taxation | $ 9,616,909 | $ 9,614,978 | $ (1,931) | 0% | 0% over budget | $ 9,219,894 | $ 9,251,211 |
| User fees | 2,825,652 | 2,822,165 | (3,487) | -0% | 0% over budget | 2,782,028 | 2,781,240 |
| Sales of services | 1,157,291 | 814,514 | (342,777) | -42% | 42% over budget | 720,598 | 817,225 |
| Penalties and fines | 93,663 | 60,000 | (33,663) | -56% | 56% over budget | 54,567 | 60,000 |
| Investment income | 99,150 | 110,000 | 10,850 | 10% | 10% under budget | 431,600 | 110,000 |
| Other revenue | 1,012,180 | 232,275 | (779,905) | -336% | 336% over budget | 444,436 | 298,743 |
| Government grants and transfers | 2,064,841 | 2,095,677 | 30,836 | 1% | 1% under budget | 4,187,270 | 3,230,138 |
| Contributions from developers and others | 183,750 | - | (183,750) | 0% | - | 37,500 | - |
| Development cost charges | - | 123,350 | 123,350 | 100% | 100% under budget | 806,024 | 859,887 |
| Transfers from reserves | 232,847 | 847,720 | 614,873 | 73% | 73% under budget | 398,146 | 986,595 |
| Transfers from reserve accounts | 1,604,882 | 2,411,061 | 806,179 | 33% | 33% under budget | 1,959,559 | 3,347,424 |
| Transfers from accumulated surplus | 24,960 | 312,508 | 287,548 | 92% | 92% under budget | 48,828 | 382,276 |
| Transfers from equity in capital assets | - | 3,087,648 | 3,087,648 | 100% | 100% under budget | 2,934,036 | 3,032,988 |
| Internal cost allocations | - | 523,163 | 523,163 | 100% | 100% under budget | 513,441 | 513,441 |
| Revenue Total | $ 18,916,125 | $ 23,055,059 | $ 4,138,934 | 18% | 18% under budget | $ 24,537,926 | $ 25,671,168 |
| Expense | |||||||
| General government services | 2,432,932 | 2,822,376 | 389,444 | 14% | 14% budget remaining | 2,913,265 | 3,874,033 |
| Protective services | 4,033,879 | 4,995,720 | 961,841 | 19% | 19% budget remaining | 4,471,647 | 5,098,361 |
| Transportation services | 2,485,780 | 4,067,439 | 1,581,659 | 39% | 39% budget remaining | 2,717,848 | 3,281,233 |
| Environmental health services | 2,316,400 | 2,541,128 | 224,728 | 9% | 9% budget remaining | 2,469,755 | 2,673,175 |
| Development services | 594,540 | 747,643 | 153,103 | 20% | 20% budget remaining | 540,979 | 789,877 |
| Parks services | 799,129 | 1,335,833 | 536,704 | 40% | 40% budget remaining | 885,221 | 1,279,625 |
| Recreation and culture services | 1,468,938 | 1,472,750 | 3,813 | 0% | 0% budget remaining | 1,305,807 | 1,306,032 |
| Interest on debt | 260,633 | 260,633 | 1 | 0% | 0% budget remaining | 260,633 | 260,633 |
| Principal payment on debt | 306,470 | 306,470 | 0 | 0% | 0% budget remaining | 306,470 | 306,470 |
| Amortization | - | 3,087,648 | 3,087,648 | 100% | 100% budget remaining | 2,934,036 | 3,032,988 |
| Internal cost allocations | - | 523,163 | 523,163 | 100% | 100% budget remaining | 513,441 | 513,441 |
| Transfers to reserves | 1,534,924 | 378,300 | (1,156,624) | -306% | 306% over budget | 1,213,449 | 712,300 |
| Transfers to reserve accounts | 1,610,281 | 515,956 | (1,094,325) | -212% | 212% over budget | 3,541,005 | 2,543,000 |
| Expense Total | 17,843,903 | 23,055,059 | 5,211,156 | 23% | 23% budget remaining | 24,073,555 | 25,671,168 |
| Grand Total | $ 1,072,222 | $0 | ($1,072,222) | $ 464,371 | $0 |
Page 25
Extracted from: 2022 01 11 Committee of the Whole Agenda - Agenda - Pdf