Attachment 6 - 10 Erskine Lane Development Transportation Impact Assessment
A comprehensive Transportation Impact Assessment (TIA) prepared by Watt Consulting Group analyzing traffic conditions, site access, and active transportation for the proposed 43-unit residential building.
10 ERSKINE LANE DEVELOPMENT
Transportation Impact Assessment
Author: Tanner Vollema, EIT Reviewer: Andy Kading, P.Eng., P.E. Date: November 23, 2021 File No.: 3174.B01
TABLE OF CONTENTS
1.0 INTRODUCTION ................................................................................................... 1 1.1 Study Area ..................................................................................................................... 1 2.0 EXISTING CONDITIONS ..................................................................................... 2 2.1 Current Land Use ......................................................................................................... 2 2.2 Road Network ............................................................................................................... 2 2.3 Traffic Model – Background Information .............................................................. 3 2.4 Existing Traffic Conditions (2021) .......................................................................... 4 2.4.1 Traffic Counts ................................................................................................. 4 2.4.2 Analysis Results ............................................................................................. 6 3.0 OPENING DAY (2023) ........................................................................................ 8 3.1 Growth Rate .................................................................................................................. 8 3.2 Concurrent Developments ........................................................................................ 8 3.3 Changes to the Road NETWORK ........................................................................... 9 3.4 Background Volumes (2023) ................................................................................... 9 4.0 POST DEVELOPMENT ...................................................................................... 10 4.1 Proposed Land Use .................................................................................................. 10 4.2 Trip Generation .......................................................................................................... 11 4.3 Trip Assignment ........................................................................................................ 12 4.4 Opening Day Conditions ......................................................................................... 14 4.4.1 AM Peak Hour ............................................................................................. 14 4.4.2 PM Peak Hour .............................................................................................. 16 5.0 10-YEAR POST DEVELOPMENT HORIZON (2033) ................................... 18 5.1 Background Volumes (2033) ................................................................................ 18 5.2 Post Development Volumes (2033) .................................................................... 19 5.3 Long Term Conditions ............................................................................................. 20 5.3.1 AM Peak Hour ............................................................................................. 20 5.3.2 PM Peak Hour .............................................................................................. 22 6.0 ACCESS REVIEW ............................................................................................... 24 6.1 Spacing ......................................................................................................................... 24 6.2 Sightlines ..................................................................................................................... 25 7.0 ACTIVE TRANSPORTATION ........................................................................... 25 7.1 Pedestrians and Cyclists ......................................................................................... 25 7.2 Transit ........................................................................................................................... 26 8.0 CONCLUSIONS .................................................................................................. 26 9.0 RECOMMENDATIONS ...................................................................................... 28
APPENDICES
Appendix A: Synchro Background
LIST OF FIGURES
Figure 1: Development Site and Key Intersections ........................................................................ 2 Figure 2: 2021 Existing Volumes ........................................................................................................ 5 Figure 3: Watkiss Way / Erskine Lane Roundabout – Concept Sketch ................................... 9 Figure 4: 2023 Background Volumes ............................................................................................. 10 Figure 5: Site Plan ................................................................................................................................. 11 Figure 6: Trip Assignment .................................................................................................................. 13 Figure 7: 2023 Post Development Volumes ................................................................................. 14 Figure 8: 2033 Background Volumes ............................................................................................. 19 Figure 9: 2033 Post Development Volumes ................................................................................. 20
LIST OF TABLES
Table 1: Existing 2021 Conditions ...................................................................................................... 6 Table 2: Trip Generation Summary – AM and PM Peak Hour ................................................. 12 Table 3: Opening Day (2023) Traffic Conditions – AM Peak Hour ........................................ 15 Table 4: Opening Day (2023) Traffic Conditions – PM Peak Hour ........................................ 17 Table 5: Long-Term (2033) Traffic Conditions – AM Peak Hour ............................................ 21 Table 6: Long-Term (2033) Traffic Conditions – PM Peak Hour ............................................ 23
1.0 INTRODUCTION
Watt Consulting Group was retained by Wiser Projects to undertake a Transportation Impact Assessment (TIA) of a proposed residential development located at 10 Erskine Lane in View Royal. The TIA examines the existing conditions as well as the opening day background and post development conditions and the long-term (10-year post development) conditions. The TIA includes a site access review and a review of the active transportation networks within the vicinity of the site.
1.1 STUDY AREA
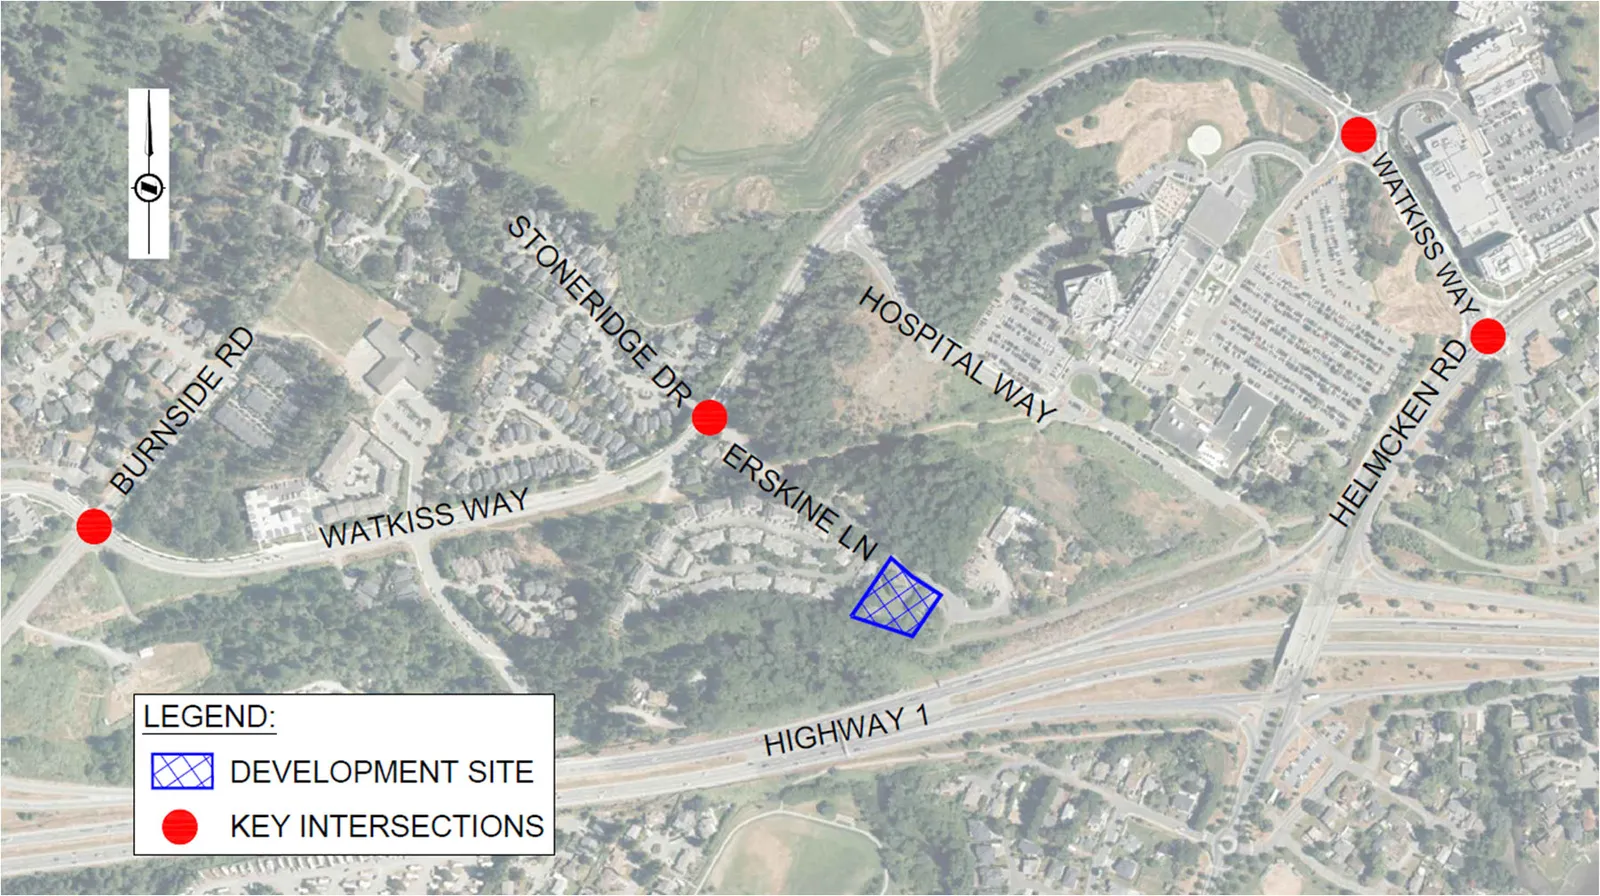
The development is located at 10 Erskine Lane in the Town of View Royal. The study area includes the following key intersections:
- Watkiss Way / Erskine Lane / Stoneridge Drive;
- Burnside Road W / Watkiss Way;
- Watkiss Way / Hospital Access / Mall Access; and
- Watkiss Way / Chancellor / Helmcken Road.
Figure 1 shows the study intersections and site location.
2.0 EXISTING CONDITIONS
2.1 CURRENT LAND USE
The development site is currently occupied by two single-family homes. The surrounding land use is a mix of single-family and multi-family residential, along with the Victoria General Hospital to the north. Multiple multi-family developments are planned near the site, including at 5 Erskine Lane, 7 Erskine Lane, and 9 Erskine Lane. Additionally, a new BC Transit HandyDart facility is planned at the Burnside Road / Watkiss Way intersection.
2.2 ROAD NETWORK
Watkiss Way is a two-lane major road with a posted speed limit of 50km/h. Burnside Road W is a two-lane collector road with a posted speed limit of 50km/h. Erskine Lane and Stoneridge Drive are two-lane local roads with a posted speed limit of 30km/h.
As Erskine Lane dead-ends south of the proposed site, all site traffic will use the intersection of Watkiss Way / Erskine Lane to access the site. The four-legged intersection of Watkiss Way / Erskine Lane is currently stop-controlled on Erskine Lane, although a roundabout is planned to be constructed in the short term (currently in design).
The Watkiss Way / Burnside Road intersection is a four-legged signalized intersection. The northbound leg has a separate left / through lane and right turn lane, with the northbound left turn having protected / permitted phasing during the PM peak hour.
The Watkiss Way / Hospital Access intersection is a single lane roundabout with a westbound-right by-pass from Watkiss Way into the Eagle Creek Village commercial development.
Helmcken Road is a major road that runs primarily northeast / southwest near the development site (for the purposes of this study, Helmcken Road is considered to run north / south). Helmcken Road has a variable cross-section ranging from 6 lanes south of Watkiss Way to 2 lanes north of Watkiss Way, with a combination of raised center median, dedicated left turn lanes and a two-way-center-left-turn-lane that provides access to residential properties between Burnside Road and Watkiss Way / Chancellor Avenue. The intersection of Helmcken Road / Watkiss Way / Chancellor Avenue is a four-legged signalized intersection. Dedicated left turn lanes, including dual northbound lefts, are provided on all approaches to the intersection and the Helmcken Road southbound approach includes a channelized right turn island. The left turn movements on Helmcken Road have protected left turn phasing. The eastbound left turn movement (Watkiss Way onto Helmcken Road) has protected/permitted left turn phasing.
2.3 TRAFFIC MODEL – BACKGROUND INFORMATION
Weekday AM and PM peak hour traffic conditions were modeled using Synchro 10 and SIDRA 8 for the opening year full build-out and 10-year post opening year with and without the development traffic to identify short-term and long-term impacts of the development. Synchro was used to analyze conditions at the stop-controlled and signalized intersections, while SIDRA was used only to analyze traffic conditions at the Watkiss Way / Hospital Access / Mall Access roundabout and the future Watkiss Way / Erskine Lane roundabout. Queue lengths for all intersections were determined by SimTraffic.
Synchro software (Synchro 9/10) provides analysis using the Highway Capacity Manual (2010) methodology, while SimTraffic integrates established driver behaviors and characteristics to simulate actual conditions by randomly “seeding” or positioning vehicles travelling throughout the network. The software generates measures of effectiveness that include level of service (LOS), delay and 95th percentile queue length. Intersections are analyzed to determine the level of service, delays and 95th percentile queue lengths. The levels of service are broken down into six letter grades with LOS A being excellent operations and LOS F indicating failing operations. Level of service C is generally considered to be an acceptable LOS by most municipalities. Level of service D is generally considered to be on the threshold between acceptable and unacceptable operations. A description of level of service and Synchro software is provided in Appendix A.
2.4 EXISTING TRAFFIC CONDITIONS (2021)
2.4.1 TRAFFIC COUNTS
Traffic turning movement counts were conducted at the Watkiss Way / Erskine Lane intersection on Wednesday, September 8, 2021, during both the AM and PM peak hours (8-9AM and 4-5PM respectively). For the remaining key intersections, traffic count data was taken from previously conducted TIA’s at 9 Erskine Lane and 7 Erskine Lane with counts for those taken on the following dates:
- Watkiss Way / Burnside Road: November 14, 2018
- Watkiss Way / Hospital Access: November 13, 2018
- Helmcken Road / Watkiss Way / Chancellor Avenue: January 20, 2020
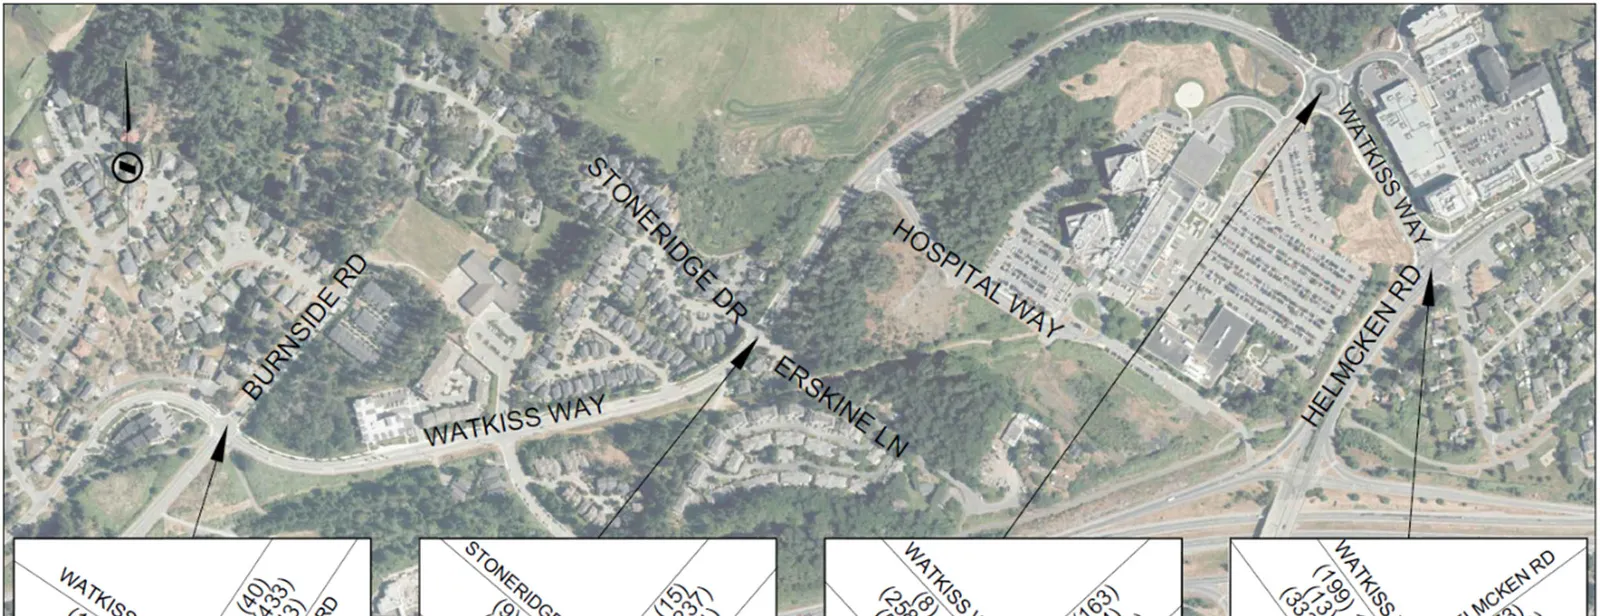
The Watkiss Way volumes were adjusted to 2021 volumes using the Watkiss Way / Erskine Lane counts to determine the volume on Watkiss Way. The Helmcken Road, Burnside Road, and Hospital Access volumes were adjusted to 2021 using an annual growth rate of 0.5% on Helmcken Road and 1% on all other roads (see Section 3.1.1 for growth rate determination). The resulting 2021 volumes are shown in Figure 2.
Note that by January 2020, traffic on Highway 1 was able to free-flow at McKenzie Avenue / Admirals Road, resulting in reduced Helmcken Road volumes (approximately -13% in the AM and -9% in the PM); however, key elements of the interchange such as the dual right turn (free flow) from McKenzie to Highway 1 and the southbound cloverleaf were not completed at that time. The completion of the interchange is expected to have further reduced the traffic volumes on the Helmcken Road, Burnside Road, and Watkiss Way corridors as the increased capacity and free-flow at the interchange draws traffic away from the circuitous routing previously utilized to avoid the delays at Highway 1 / McKenzie / Admirals. As a result, the traffic volumes utilized for this study should be considered conservative.
2.4.2 ANALYSIS RESULTS
The existing 2021 volumes were analyzed in Synchro / SIDRA software to determine the existing 2021 conditions during the AM and PM peak hours, using the existing signal timings for each intersection. The analysis results are summarized in Table 1.
TABLE 1: EXISTING 2021 CONDITIONS
| Intersection (EW / NS) | Movement | AM Peak LOS | AM Peak Delay (s) | AM Peak 95th % Queue (m) | PM Peak LOS | PM Peak Delay (s) | PM Peak 95th % Queue (m) |
|---|---|---|---|---|---|---|---|
| Watkiss Way / Burnside Road | EB L/T/R | C | 21.9 | 36.3 | B | 11.8 | 23.7 |
| WB L/T/R | C | 30.9 | 31.8 | C | 31.2 | 50.5 | |
| NB L/T | B | 10.9 | 55.7 | A | 9.8 | 55.1 | |
| NBR | A | 1.9 | 24.7 | A | 1.8 | 18.0 | |
| SB L/T/R | A | 6.7 | 28.3 | B | 11.3 | 56.4 | |
| Watkiss Way / Erskine Lane / Stoneridge Drive | EB L/T/R | A | 0.0 | 3.4 | A | 0.2 | 3.5 |
| WB L/T/R | A | 0.5 | 5.1 | A | 0.4 | 6.6 | |
| NB L/T/R | B | 13.1 | 11.1 | B | 12.3 | 10.8 | |
| SB L/T/R | C | 16.5 | 8.3 | B | 14.3 | 7.1 | |
| Watkiss Way / Hospital Access / Eagle Creek Village Access | EB L/T/R | B | 7.8 | 26.6 | A | 9.0 | 20.7 |
| WB L/T | A | 7.2 | 25.7 | A | 6.7 | 13.5 | |
| WBR | A | 0.0 | 3.2 | A | 2.0 | 2.5 | |
| NB L/T/R | A | 7.0 | 11.6 | B | 13.7 | 18.5 | |
| SB L/T/R | A | 7.4 | 10.7 | A | 9.5 | 14.8 | |
| Watkiss Way / Chancellor Ave / Helmcken Road | EB L/T | D | 39.9 | 49.8 | E | 65.8 | 83.2 |
| EBR | A | 5.4 | 37.0 | B | 15.4 | 75.9 | |
| WBL | C | 24.2 | 6.7 | D | 47.5 | 10.5 | |
| WB T/R | B | 15.7 | 1.7 | C | 29.2 | 1.6 | |
| NBL | E | 72.2 | 46.9 | E | 77.9 | 42.1 | |
| NB T/R | B | 12.7 | 51.1 | B | 11.1 | 52.9 | |
| SBL | D | 47.6 | 8.4 | E | 76.0 | 12.0 | |
| SBT | C | 28.4 | 101.0 | C | 24.2 | 158.6 | |
| SBR | A | 3.6C | 24.2 | A | 1.3 | 25.8 |
Under 2021 existing volumes, the signalized Watkiss Way / Burnside Road intersection operates well with all movements at LOS C or better during both the AM and PM peak hours. The two-way stop controlled Watkiss Way / Erskine Lane intersection operates well with all movements at LOS A/B during both peak hours except for the southbound movement which is at LOS C in the AM. The Watkiss Way / Hospital Access roundabout operates well under existing conditions with all movements at LOS A/B during both peak hours.
At the signalized Helmcken Road / Watkiss Way intersection, the northbound left turn movement operates at a LOS E during both peak periods. During the PM peak hour, the eastbound left / through and southbound left movements are also at LOS E. The remaining movements are at LOS D or better (most at C or better) during both peak hours. There is no left turn queuing issues at this intersection; however, for the eastbound right turn the queue is approximately 10m (1-2 vehicles) longer than the lane which means at times eastbound left/through and right turning vehicles may block each other.
3.0 OPENING DAY (2023)
The proposed development is expected to be completed by 2023. The 2023 background volumes were determined by adding known concurrent developments and applying a growth rate to the remaining existing volumes.
3.1 GROWTH RATE
Annual growth rates for traffic along the study area roads were determined by comparing historical traffic volumes along Watkiss Way and Helmcken Road. Based on CRD traffic count data, between 2008 and 2014 the average daily traffic along Watkiss Way grew less than 1% annually, while volumes on Helmcken Road grew 0.2% annually between 2014 and 2019.
There is limited opportunity for additional development on the Watkiss Way corridor, especially given that the lands in the District of Saanich along Watkiss Way are currently in the Agricultural Land Reserve and are unlikely to be developed. The Helmcken Road corridor is currently at or near capacity, with traffic often backed up to the Wilkinson / Interurban intersection; therefore, limited traffic growth (in a one-hour time period) is expected on Helmcken Road. Based on the above, a 0.5% growth rate was used for Helmcken Road, and a 1% growth rate was used on the remaining roads in the study area.
3.2 CONCURRENT DEVELOPMENTS
There are multiple concurrent developments occurring along the Watkiss Way corridor, including multi-family developments at 5 Erskine Lane, 7 Erskine Lane, and 9 Erskine Lane, as well as the BC Transit HandyDart facility on the southeast corner of the Burnside Road / Watkiss Way intersection. The trip assignments for 5 Erskine Lane, 7 Erskine Lane and 9 Erskine Lane are based on TIAs conducted for the development by WATT, while the HandyDart trip assignment is based on the WSP HandyDart Operations and Maintenance Facility Traffic Impact Study update memo (dated June 2, 2020).
3.3 CHANGES TO THE ROAD NETWORK
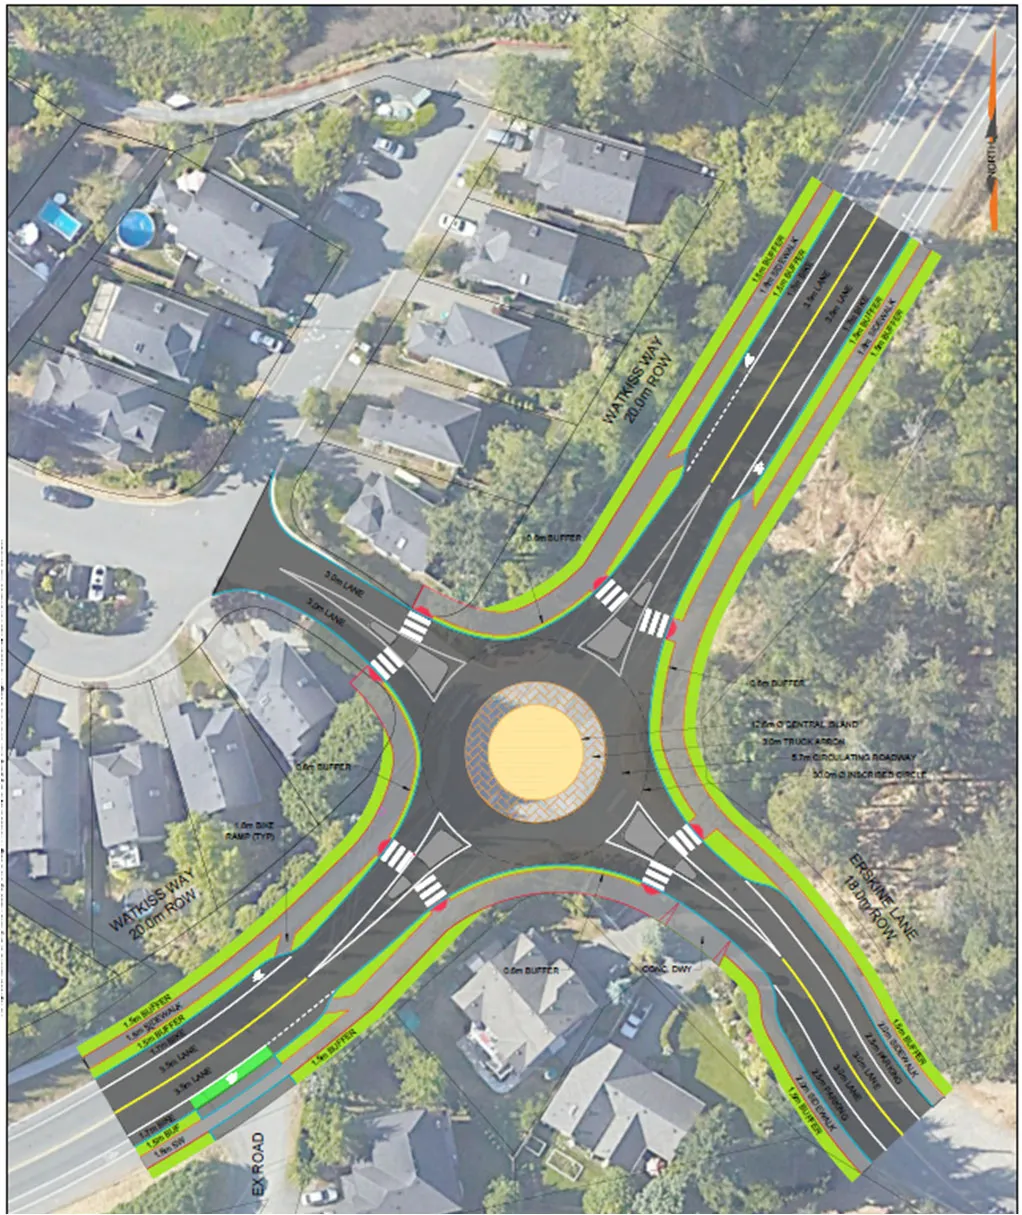
By 2023, the Watkiss Way / Erskine Lane intersection is planned to be upgraded to a single lane roundabout (concept sketch shown in Figure 3). Therefore, the intersection will be modelled as a roundabout in the analysis of the opening day background and post development conditions.
3.4 BACKGROUND VOLUMES (2023)
The 2023 background volumes were determined by applying the growth rate determined in Section 3.1 to the existing volumes, and then adding the volumes expected to be generated from the concurrent developments. The resulting 2023 AM and PM peak hour volumes are shown in Figure 4. The background volumes were then analyzed in Synchro / SimTraffic / SIDRA software to determine the 2023 background conditions (see Section 4.4 for the analysis results).

4.0 POST DEVELOPMENT
4.1 PROPOSED LAND USE
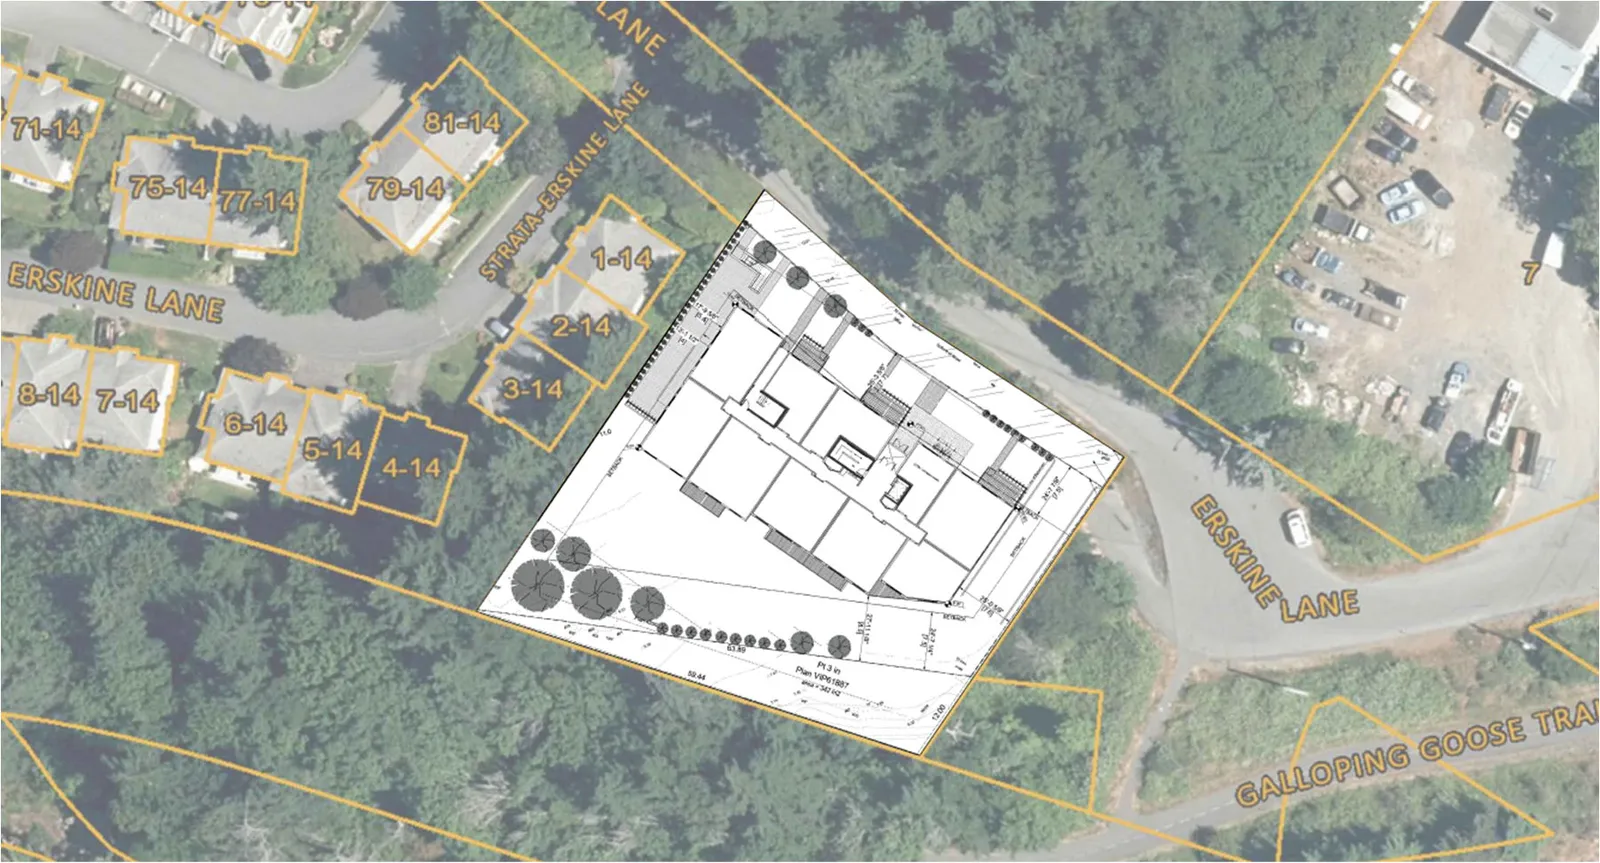
The proposed development is a 5-storey multi-family residential building containing 43 residential units. The development will include surface and underground parking and will be accessed via a single access on Erskine Lane. The development is expected to be completed by 2023. The site plan is shown in Figure 5.
4.2 TRIP GENERATION
The number of site trips expected to be generated from the proposed development were calculated using the Institute of Transportation Engineers’ (ITE) Trip Generation Manual (11th Edition). The Trip Generation Manual provides trip rates for a wide variety of land uses gathered from actual sites across North America over the past 40 years.
The results of the trip generation are summarized in Table 2. The development is expected to generate 16 trips (4 inbound / 12 outbound) during the AM peak hour and 17 trips (10 inbound / 7 outbound) during the PM peak hour.
TABLE 2: TRIP GENERATION SUMMARY – AM AND PM PEAK HOUR
| ITE Code | Land Use | Units | Trip Rate | Trips In | Trips Out | Total Trips |
|---|---|---|---|---|---|---|
| AM Peak Hour | ||||||
| 221 | Multifamily Housing (Mid-Rise) | 43 Units | 0.37 / unit | 4 | 12 | 16 |
| Total (AM Peak): | 4 | 12 | 16 | |||
| PM Peak Hour | ||||||
| 221 | Multifamily Housing (Mid-Rise) | 43 Units | 0.39 / unit | 10 | 7 | 17 |
| Total (PM Peak): | 10 | 7 | 17 |
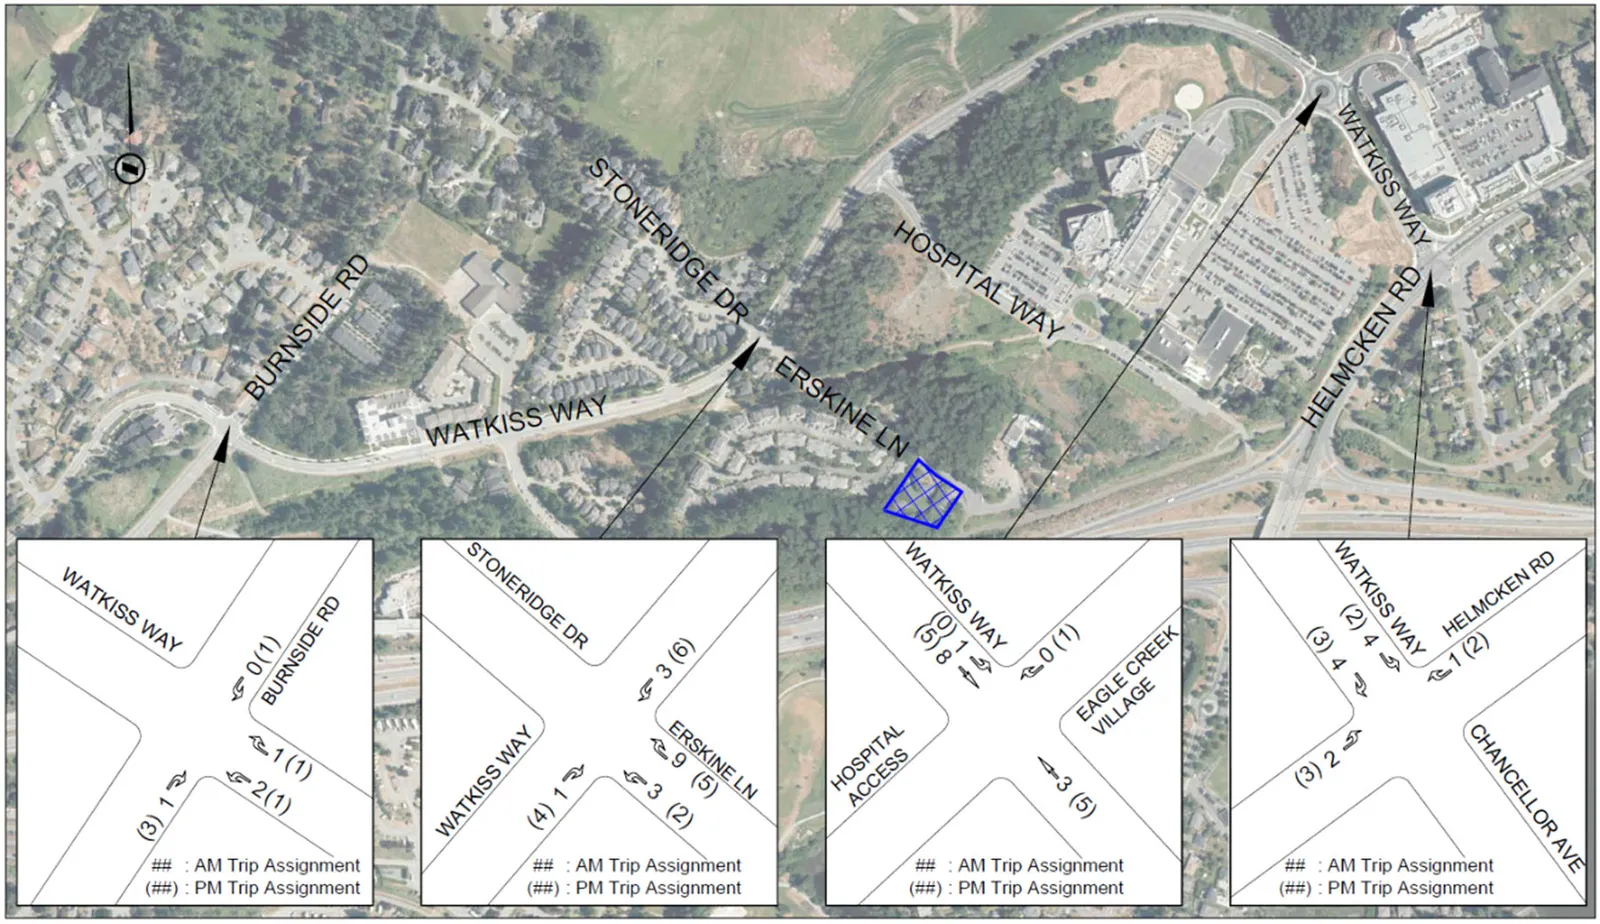
4.3 TRIP ASSIGNMENT
The trip assignment for the primary trips were based on the existing traffic patterns and the key origins and destinations for traffic in the area. The trips generated by the development during the AM and PM peak hours were assigned based on the following distribution ratios:
Inbound Trips (AM and PM):
- 15% of inbound trips come from Helmcken Road (North);
- 35% of inbound trips come from Helmcken Road (South);
- 10% of inbound trips come from Burnside Road (North);
- 35% of inbound trips come from Burnside Road (South); and
- 5% of inbound trip come from Eagle Creek Village.
Outbound Trips (AM and PM):
- 30% of outbound trips are heading to Helmcken Road (North);
- 35% of outbound trips are heading to Helmcken Road (South);
- 10% of outbound trips are heading to Burnside Road (North);
- 20% of outbound trips are heading to Burnside Road (South); and
- 5% of outbound trips are heading to Eagle Creek Village.
The resulting trip assignment is shown in Figure 6.
The 2023 post development volumes were obtained by adding the trips generated by the site to the 2023 background volumes. The resulting 2023 post development volumes are shown in Figure 7.
4.4 OPENING DAY CONDITIONS
The opening day (2023) background and post development volumes were analyzed in Synchro / SimTraffic / SIDRA software to determine the opening day conditions during the AM and PM peak hours. The post development conditions were compared to the background conditions during each peak hour to determine the impact of the development on the study area road network. The modelling included the new Watkiss Way / Erskine Lane single-lane roundabout that is expected to be constructed by 2023.
4.4.1 AM PEAK HOUR
The 2023 background and post development AM peak hour analysis results are summarized in Table 3.
TABLE 3: OPENING DAY (2023) TRAFFIC CONDITIONS – AM PEAK HOUR
| Intersection (EW / NS) | Movement | 2023 Background LOS | 2023 Background Delay (s) | 2023 Background 95th % Queue (m) | 2023 Post Dev. LOS | 2023 Post Dev. Delay (s) | 2023 Post Dev. 95th % Queue (m) |
|---|---|---|---|---|---|---|---|
| Watkiss Way / Burnside Road | EB L/T/R | B | 19.5 | 31.9 | B | 19.4 | 33.5 |
| WB L/T/R | D | 49.2 | 43.9 | D | 51.0 | 46.5 | |
| NB L/T | B | 13.4 | 58.2 | B | 13.5 | 58.4 | |
| NBR | A | 2.0 | 24.3 | A | 2.0 | 28.3 | |
| SB L/T/R | A | 7.7 | 31.9 | A | 7.7 | 34.6 | |
| Watkiss Way / Erskine Lane / Stoneridge Drive | EB L/T/R | A | 6.1 | 15.9 | A | 6.2 | 13.7 |
| WB L/T/R | A | 5.2 | 12.0 | A | 5.2 | 10.4 | |
| NB L/T/R | A | 7.0 | 16.4 | A | 7.3 | 15.2 | |
| SB L/T/R | A | 4.2 | 5.8 | A | 4.3 | 5.2 | |
| Watkiss Way / Hospital Access / Eagle Creek Village Access | EB L/T/R | B | 15.2 | 34.0 | B | 15.6 | 37.1 |
| WB L/T | A | 8.0 | 33.4 | A | 8.1 | 32.0 | |
| WBR | A | 0.0 | 29.2 | A | 0.0 | 1.8 | |
| NB L/T/R | A | 8.2 | 12.5 | A | 8.3 | 13.5 | |
| SB L/T/R | A | 8.0 | 11.9 | A | 8.0 | 11.7 | |
| Watkiss Way / Chancellor Ave / Helmcken Road | EB L/T | D | 42.5 | 65.0 | D | 42.8 | 62.8 |
| EBR | A | 4.8 | 51.6 | A | 4.8 | 46.9 | |
| WBL | C | 23.4 | 6.2 | C | 23.4 | 6.1 | |
| WB T/R | B | 14.8 | 1.7 | B | 14.8 | 1.3 | |
| NBL | F | 116.2 | 62.6 | F | 120.0 | 52.6 | |
| NB T/R | B | 15.4 | 38.0 | B | 15.6 | 59.4 | |
| SBL | D | 50.2 | 10.6 | D | 50.4 | 8.9 | |
| SBT | C | 34.5 | 113.3 | C | 35.0 | 102.1 | |
| SBR | A | 4.6 | 25.5 | A | 4.7 | 26.2 |
Under 2023 AM peak hour background volumes, the Watkiss Way / Burnside Road intersection operates adequately, with the westbound movement at LOS D while the remaining movements are at LOS A/B. The Watkiss Way / Erskine Lane and Watkiss Way / Hospital Access roundabouts operate well (all movements at LOS A/B) in the AM peak hour under background conditions.
At the Watkiss Way / Helmcken Road intersection, the northbound left turn is failing (LOS F) under background conditions. The remaining movements are at LOS D or better during the AM peak. Signal timing adjustments to the intersection in Synchro resulted in all movements operating at LOS D or better and should be considered to improve the operations of the Watkiss Way / Helmcken Road intersection.
Under post development volumes, the addition of site traffic does not impact the operations of the study intersections in the AM peak hour. No changes to the levels of service occur at any of the intersections as a result of development traffic. All 95th percentile turn lane queues at Watkiss Way / Helmcken Road are less than the provided storage.
4.4.2 PM PEAK HOUR
The 2023 background and post development PM peak hour analysis results are summarized in Table 4.
TABLE 4: OPENING DAY (2023) TRAFFIC CONDITIONS – PM PEAK HOUR
| Intersection (EW / NS) | Movement | 2023 Background LOS | 2023 Background Delay (s) | 2023 Background 95th % Queue (m) | 2023 Post Dev. LOS | 2023 Post Dev. Delay (s) | 2023 Post Dev. 95th % Queue (m) |
|---|---|---|---|---|---|---|---|
| Watkiss Way / Burnside Road | EB L/T/R | B | 11.5 | 25.5 | B | 11.5 | 25.1 |
| WB L/T/R | D | 35.5 | 50.8 | D | 35.9 | 54.0 | |
| NB L/T | B | 10.8 | 55.8 | B | 10.8 | 52.1 | |
| NBR | A | 1.8 | 20.1 | A | 1.8 | 21.6 | |
| SB L/T/R | B | 14.5 | 78.9 | B | 14.7 | 70.1 | |
| Watkiss Way / Erskine Lane / Stoneridge Drive | EB L/T/R | A | 6.5 | 18.1 | A | 6.7 | 18.7 |
| WB L/T/R | A | 6.1 | 13.7 | A | 6.2 | 15.7 | |
| NB L/T/R | A | 5.0 | 11.2 | A | 5.1 | 13.3 | |
| SB L/T/R | A | 4.5 | 5.6 | A | 4.5 | 4.6 | |
| Watkiss Way / Hospital Access / Eagle Creek Village Access | EB L/T/R | B | 11.0 | 25.6 | B | 11.1 | 31.5 |
| WB L/T | A | 7.9 | 28.9 | A | 8.0 | 30.4 | |
| WBR | A | 0.9 | 3.8 | A | 0.8 | 3.4 | |
| NB L/T/R | B | 17.1 | 20.7 | B | 17.3 | 23.1 | |
| SB L/T/R | B | 12.1 | 19.0 | B | 12.3 | 21.0 | |
| Watkiss Way / Chancellor Ave / Helmcken Road | EB L/T | E | 69.2 | 114.5 | E | 69.4 | 146.2 |
| EBR | C | 20.8 | 85.4 | C | 21.1 | 85.5 | |
| WBL | D | 47.7 | 10.3 | D | 47.8 | 11.2 | |
| WB T/R | C | 29.0 | 1.8 | C | 29.0 | 2.1 | |
| NBL | F | 95.2 | 82.3 | F | 96.8 | 73.6 | |
| NB T/R | B | 12.0 | 84.9 | B | 12.0 | 60.5 | |
| SBL | E | 77.3 | 13.4 | E | 77.3 | 12.0 | |
| SBT | C | 26.5 | 172.7 | C | 26.6 | 181.8 | |
| SBR | A | 3.0 | 24.1 | A | 3.2 | 23.4 |
Under 2023 PM peak hour background volumes, the Watkiss Way / Burnside Road intersection operates adequately with the westbound movement operating at LOS D while the remaining movements are at LOS A/B. The roundabouts at Watkiss Way / Erskine Lane and Watkiss Way / Hospital Access operate well (LOS A/B for all movements) under PM background conditions.
At the Watkiss Way / Helmcken Road intersection, under background conditions, there are multiple movements at LOS E/F in the PM peak hour, including the eastbound left / through movement and the northbound and southbound left turn movements. Signal timing adjustments to the intersection in Synchro resulted in all movements operating at LOS D or better and could be considered to improve the operations of the Watkiss Way / Helmcken Road intersection. The eastbound left/through and eastbound right turn queues extend beyond the right turn lane with and without the development traffic. Both the eastbound left/through and right turn movements are impacting the adjacent lane movements traffic. The northbound and southbound left turn queue lengths are less than the provided storage with and without the development.
Under post-development conditions, the addition of site traffic does not impact the operations or queue lengths at the study intersections during the PM peak hour, and the levels of service are unchanged with the addition of site traffic compared to background conditions.
5.0 10-YEAR POST DEVELOPMENT HORIZON (2033)
In order to determine the long-term impact of the proposed development, the long-term background and post development conditions were examined for the 10-year post development horizon (2033).
5.1 BACKGROUND VOLUMES (2033)
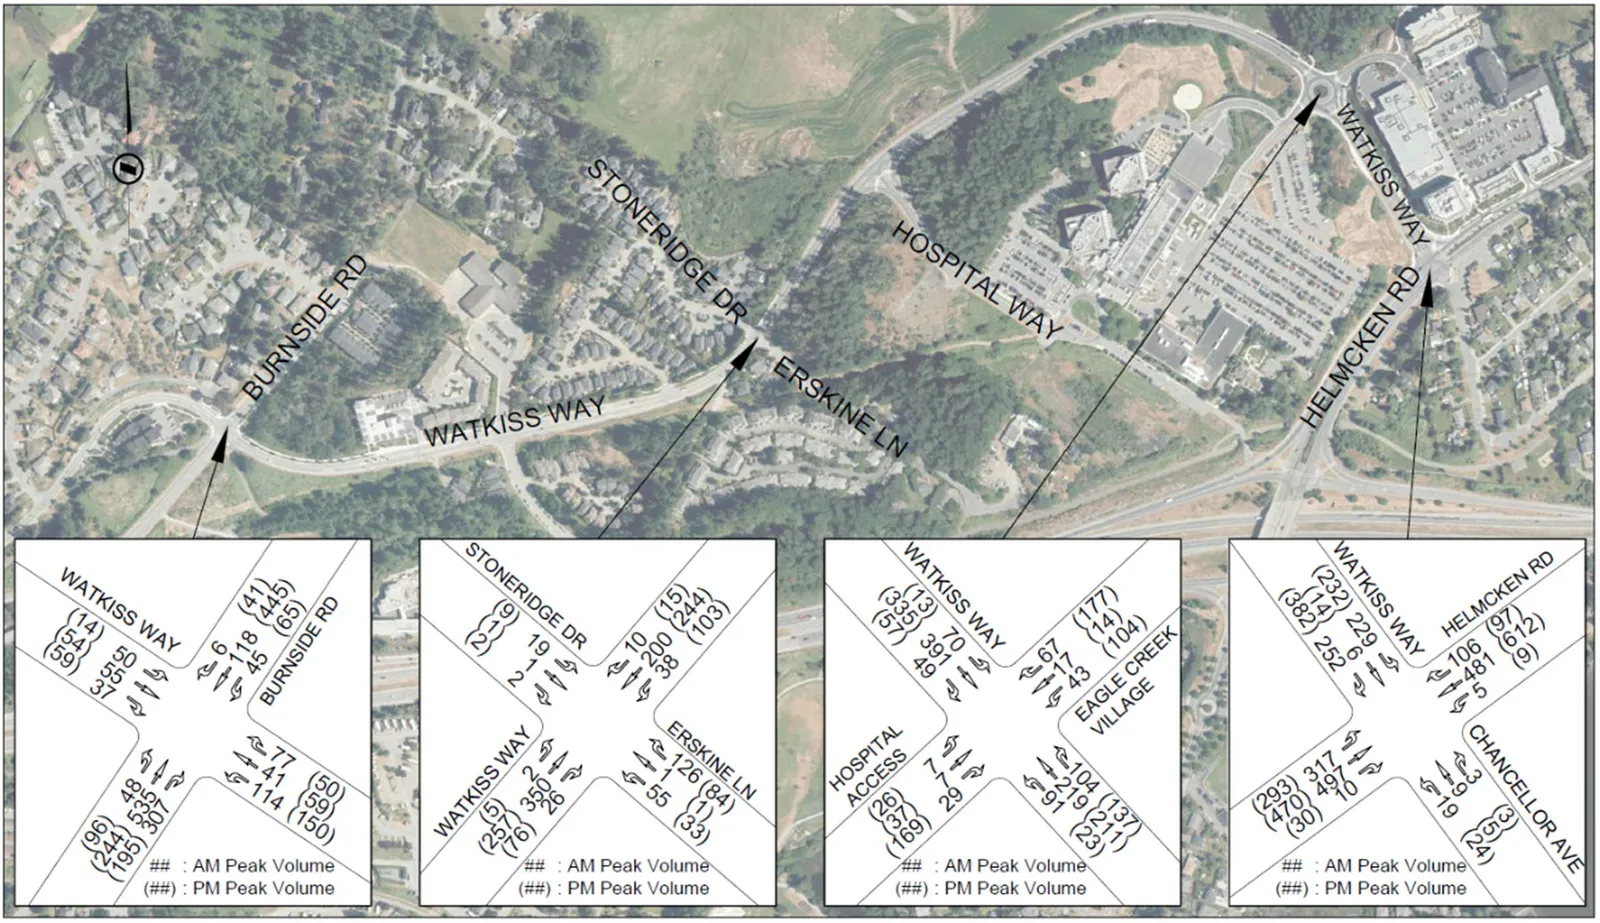
The long-term 2033 background volumes were determined by applying the annual growth rates of 0.5% to Helmcken Road and 1% to all other roads to the 2023 background volumes plus the concurrent developments. The resulting 2033 background volumes are shown in Figure 8.
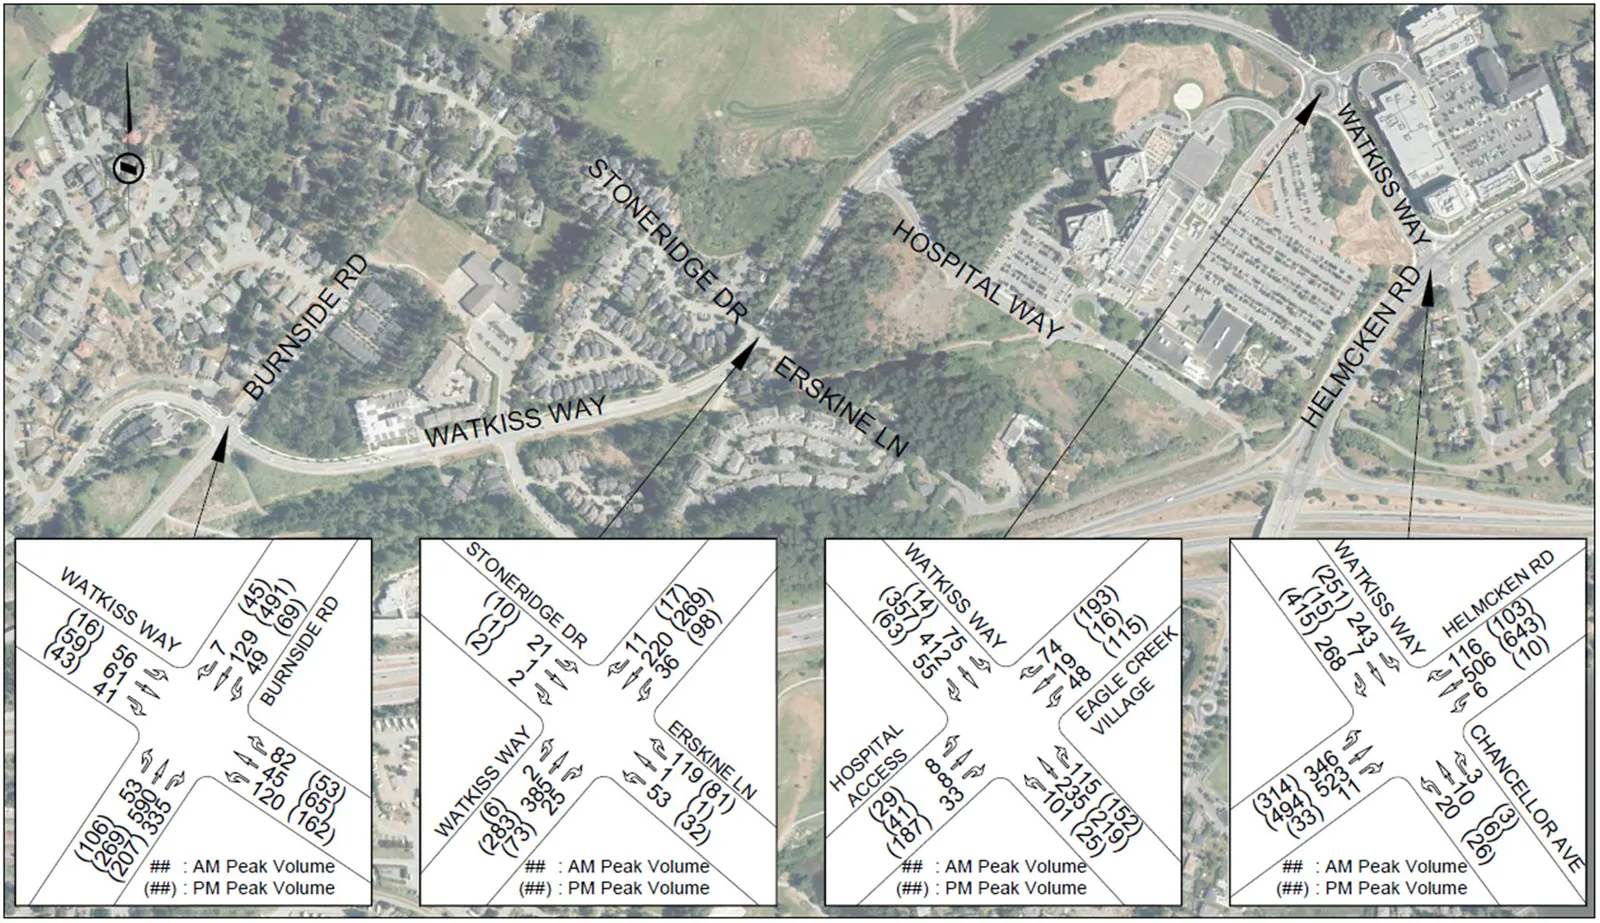
5.2 POST DEVELOPMENT VOLUMES (2033)
The 2033 post development volumes were obtained by adding the trips generated by the site to the 2033 background volumes. The resulting 2033 post development volumes are shown in Figure 9.

5.3 LONG TERM CONDITIONS
The long-term (2033) background and post development volumes were analyzed in Synchro / SimTraffic / SIDRA software to determine the long-term conditions during the AM and PM peak hours. The post development conditions were compared to the background conditions during each peak hour to determine the long-term impact of the development on the study area road network.
5.3.1 AM PEAK HOUR
The 2033 background and post development AM peak hour analysis results are summarized in Table 5.
TABLE 5: LONG-TERM (2033) TRAFFIC CONDITIONS – AM PEAK HOUR
| Intersection (EW / NS) | Movement | 2033 Background LOS | 2033 Background Delay (s) | 2033 Background 95th % Queue (m) | 2033 Post Dev. LOS | 2033 Post Dev. Delay (s) | 2033 Post Dev. 95th % Queue (m) |
|---|---|---|---|---|---|---|---|
| Watkiss Way / Burnside Road | EB L/T/R | C | 20.7 | 35.3 | C | 20.7 | 38.1 |
| WB L/T/R | E | 61.8 | 46.9 | E | 64.8 | 47.2 | |
| NB L/T | B | 16.2 | 61.8 | B | 16.2 | 66.7 | |
| NBR | A | 2.1 | 27.9 | A | 2.1 | 30.2 | |
| SB L/T/R | A | 8.6 | 38.3 | A | 8.6 | 39.0 | |
| Watkiss Way / Erskine Lane / Stoneridge Drive | EB L/T/R | A | 6.5 | 16.5 | A | 6.6 | 20.0 |
| WB L/T/R | A | 5.4 | 13.6 | A | 5.5 | 13.7 | |
| NB L/T/R | A | 7.5 | 17.0 | A | 7.8 | 18.0 | |
| SB L/T/R | A | 4.4 | 7.7 | A | 4.5 | 7.2 | |
| Watkiss Way / Hospital Access / Eagle Creek Village Access | EB L/T/R | B | 18.7 | 36.7 | B | 19.4 | 37.3 |
| WB L/T | A | 8.7 | 33.0 | A | 8.8 | 33.1 | |
| WBR | A | 0.0 | 4.0 | A | 0.0 | 40.2 | |
| NB L/T/R | A | 8.9 | 11.8 | A | 9.0 | 14.7 | |
| SB L/T/R | A | 8.9 | 12.1 | A | 8.9 | 13.4 | |
| Watkiss Way / Chancellor Ave / Helmcken Road | EB L/T | D | 45.3 | 66.8 | D | 46.0 | 73.2 |
| EBR | A | 6.3 | 55.9 | A | 6.5 | 62.0 | |
| WBL | C | 23.9 | 7.0 | C | 24.0 | 7.3 | |
| WB T/R | B | 15.4 | 2.3 | B | 15.4 | 0.7 | |
| NBL | F | 166.8 | 86.3 | F | 171.2 | 83.7 | |
| NB T/R | B | 18.1 | 81.9 | B | 18.2 | 87.0 | |
| SBL | D | 51.8 | 8.9 | D | 52.0 | 9.5 | |
| SBT | D | 38.2 | 140.0 | D | 38.5 | 179.4 | |
| SBR | A | 5.7 | 25.1 | A | 5.8 | 25.6 |
Under 2033 background conditions, the westbound movement at the Watkiss Way / Burnside Road intersection operates at LOS E during the AM peak hour with the existing signal timing. The remaining movements are at LOS C or better. The operations of the intersections can be improved to acceptable levels (LOS D or better for all movements) by optimizing the signal timing. The Watkiss Way / Erskine Lane and Watkiss Way / Hospital Access roundabouts operate well, with all movements at LOS A/B under AM peak hour background conditions.
At the Watkiss Way / Helmcken Road intersection, the northbound left turn will operate at a LOS F under 2033 background conditions and the 95th percentile queues do not exceed the storage. Multiple other movements are at LOS D, including the southbound left, southbound through, and eastbound left / through movements. Signal timing adjustments to the intersection in Synchro resulted in all movements operating at LOS D or better and could be considered to improve the operations of the Watkiss Way / Helmcken Road intersection.
Under 2033 post development conditions, the addition of development traffic does not impact the operations or queues at the study intersections during the AM peak hour. The levels of service of all movements are unchanged from 2033 background conditions.
5.3.2 PM PEAK HOUR
The 2033 background and post development PM peak hour analysis results are summarized in Table 6.
TABLE 6: LONG-TERM (2033) TRAFFIC CONDITIONS – PM PEAK HOUR
| Intersection (EW / NS) | Movement | 2033 Background LOS | 2033 Background Delay (s) | 2033 Background 95th % Queue (m) | 2033 Post Dev. LOS | 2033 Post Dev. Delay (s) | 2033 Post Dev. 95th % Queue (m) |
|---|---|---|---|---|---|---|---|
| Watkiss Way / Burnside Road | EB L/T/R | B | 11.6 | 28.4 | B | 11.5 | 29.7 |
| WB L/T/R | D | 41.1 | 60.6 | D | 41.4 | 71.7 | |
| NB L/T | B | 12.7 | 80.6 | B | 12.8 | 86.4 | |
| NBR | A | 1.8 | 20.6 | A | 1.8 | 23.4 | |
| SB L/T/R | B | 19.1 | 91.2 | B | 19.2 | 91.1 | |
| Watkiss Way / Erskine Lane / Stoneridge Drive | EB L/T/R | A | 6.9 | 17.3 | A | 7.1 | 18.8 |
| WB L/T/R | A | 6.4 | 14.9 | A | 6.6 | 19.2 | |
| NB L/T/R | A | 5.2 | 12.8 | A | 5.3 | 13.2 | |
| SB L/T/R | A | 4.7 | 5.7 | A | 4.7 | 5.0 | |
| Watkiss Way / Hospital Access / Eagle Creek Village Access | EB L/T/R | B | 12.6 | 28.1 | B | 12.7 | 27.7 |
| WB L/T | A | 8.5 | 31.8 | A | 8.6 | 30.5 | |
| WBR | A | 1.0 | 2.4 | A | 1.0 | 5.5 | |
| NB L/T/R | C | 22.7 | 21.6 | C | 23.0 | 23.4 | |
| SB L/T/R | B | 14.2 | 22.0 | B | 14.5 | 22.7 | |
| Watkiss Way / Chancellor Ave / Helmcken Road | EB L/T | E | 71.5 | 157.1 | E | 71.7 | 168.8 |
| EBR | C | 27.8 | 86.9 | C | 28.1 | 85.7 | |
| WBL | D | 48.7 | 14.1 | D | 48.8 | 12.9 | |
| WB T/R | C | 30.0 | 0.7 | C | 30.0 | 2.2 | |
| NBL | F | 114.5 | 97.5 | F | 116.9 | 106.8 | |
| NB T/R | B | 13.7 | 104.3 | B | 13.7 | 118.4 | |
| SBL | E | 79.0 | 11.0 | E | 79.0 | 11.5 | |
| SBT | C | 28.6 | 186.4 | C | 28.7 | 202.9 | |
| SBR | A | 3.7 | 22.8 | A | 3.9 | 24.5 |
Under 2033 background volumes, the Watkiss Way / Burnside Road intersection operates adequately during the PM peak hour, with all movements at LOS D or better and most at LOS A/B. The roundabouts at Watkiss Way / Erskine Lane and Watkiss Way / Hospital Access operate well under background volumes, with all movements at LOS C or better during the PM peak hour.
At the Watkiss Way / Helmcken Road intersection, there are multiple failing movements during the PM peak hour, with the northbound left turn at LOS F and the southbound left and eastbound left / through movements at LOS E under background conditions. Signal timing adjustments to the intersection in Synchro resulted in all movements operating at LOS D or better and should be considered to improve the operations of the Watkiss Way / Helmcken Road intersection. The northbound left turn 95th percentile queue lengths will be within 10m of the back of the storage available in the dual lanes without the development. The eastbound 95th percentile queues will not extend back to the Watkiss / Hospital / Eagle Creek roundabout however, the eastbound left / through and eastbound right turn queues will block each other and extend the queues in the single lane section with and without the development.
Under 2033 post development conditions, the addition of the development traffic does not impact the operations of the study intersections during the PM peak hour. The LOS of all movements are unchanged from 2033 background conditions. In the 2033 post-development scenario the northbound left turn exceeds the provided dual lane storage by 10m (less than 2 vehicle lengths). This can be handled by the additional storage length provided for the outside left turn lane which has an additional 10m of parallel storage (105m) compared to the inside left turn lane (95m). Adjustments to signal timing, in the long term, may also improve this queue length.
6.0 ACCESS REVIEW
6.1 SPACING
The proposed site access is located on Erskine Lane 270m south of Watkiss Way, which exceeds the TAC recommended minimum corner clearance of 15m for local roads from a stop-controlled major intersection. The spacing between the access and the driveway for the adjacent property is 70m, which exceeds the 5m spacing recommended by TAC. Based on the above, the access spacing for the proposed development is appropriate.
6.2 SIGHTLINES
The TAC Geometric Design Guide for Canadian Roads (2017) provides recommended minimum intersection sight distances for drivers turning out onto a road from a stop-controlled intersection. For turning onto a road with a speed limit of 30km/h, TAC recommends a sight distance of 65m looking to the right and 55m looking to the left (Tables 9.9.4 / 9.9.6).
The development access is located at the south end of Erskine Lane. For exiting drivers looking left (to the north), the sightline is 120m, which exceeds the TAC recommendation. For drivers looking to the right (south), the sight line extends to the end of Erskine Lane, a distance of 45m. Although this is 20m less than the TAC recommendation, the only traffic on Erskine south of the proposed access is to the 5 Erskine Lane and 7 Erskine Lane developments which both have accesses at the end of Erskine Lane. Drivers exiting the 10 Erskine Lane development will be able to see traffic exiting the 5 Erskine Lane and 7 Erskine Lane developments and therefore will be able to adequately determine when it is safe to turn out of the development. As a result, the sightlines for the 10 Erskine Lane access are adequate.
7.0 ACTIVE TRANSPORTATION
7.1 PEDESTRIANS AND CYCLISTS
Currently, Erskine Lane does not have any pedestrian or cyclist infrastructure, however since Erskine Lane is a dead-end roadway less than 300m in length with low volumes and speeds, pedestrians and cyclists may travel on Erskine Lane without requiring dedicated infrastructure. However, with the development of 5, 7, and 9 Erskine Lane upgrades to the pedestrian / bicycle facilities on Erskine Lane are planned as per the Town of View Royal VRSD-R10 cross section.
There are bike lanes on both sides of Watkiss Way and Helmcken Road within the study area, as well as on Burnside Road north of Watkiss Way. Watkiss Way has a sidewalk along the north side of the road that runs from Burnside Road to the transit stop east of Erskine Lane. With 9 Erskine Lane development there will be sidewalk provided along their Watkiss Way frontage.
The development site is adjacent to the Galloping Goose multi-use pathway, which offers a connection to the Victoria General Hospital and the Eagle Creek Village commercial area as well as to downtown Victoria and Langford (via the E&N Rail Trail). A paved connection to the Goose is located 30m from the access. There is also an informal gravel pathway on CRD utility right-of-way (informally referred to as the ‘Hospital Trail’) located 140m north of the site off Erskine Lane. This pathway is usable by pedestrians but is not fully accessible. The Hospital Trail provides a connection to the Victoria General Hospital to the east and to the transit stop at the Watkiss Way / Talcott Road intersection to the west.
7.2 TRANSIT
The nearest transit stops are located 290m northwest of the site on Watkiss Way, just east of Erskine Lane. These stops are serviced by BC Transit Routes #22 (Vic General / Hillside Centre), #39 (Westhills / Interurban / Royal Oak / UVic), and #53 (Victoria General Hospital / Langford Exch). All three routes provide frequent service (every 15-30min) and provide connections to the University of Victoria, Camosun College (Interuban Campus), the shopping centres at Royal Oak and Hillside Centre, and downtown Victoria and Langford. The site is also within 500m of the bus stops at the Helmcken Road interchange. Routes 14, 47, 48, 50, 51, 61, 65, 66 and 99 stop at the Helmcken Road Interchange bus stops and provide service to downtown, UVIC, Esquimalt, Royal Jubilee Hospital, Langford and Colwood (Langford Exchange and Colwood Exchange), and Sooke. This site very well serviced by transit within a short walk (less than 500m).
8.0 CONCLUSIONS
The Watkiss Way / Burnside Road, Watkiss Way / Erskine Lane, and Watkiss Way / Hospital Access intersections operate well under existing conditions, with all movements at LOS C or better during the AM and PM peak periods. At the Watkiss Way / Helmcken Road intersection, the northbound left turn operates at LOS E during both peak hours, and the southbound left and eastbound left / through movements also operate at LOS E during the PM peak hour.
By 2023 (opening day of the proposed development), a roundabout is expected to be installed at the Watkiss Way / Erskine Lane intersection. Additionally, the concurrent developments at 5 Erskine Lane, 7 Erskine Lane, 9 Erskine Lane, and the HandyDart facility are expected to be completed. Under 2023 background conditions, the Watkiss Way / Burnside Road signal operates adequately with all movements at LOS D or better in both peak hours, while the Watkiss Way / Erskine Lane and Watkiss Way / Hospital Access roundabouts operate well (LOS A/B) in both the AM and PM. At the Watkiss Way / Helmcken Road intersection, under background conditions the northbound left turn drops to LOS F in the AM peak hour (and remains at a LOS F in the PM), and the southbound left and eastbound left / through remain at LOS E in the PM. The development does not significantly impact the traffic operations in 2023, with no changes to the intersection LOS occurring as a result of the addition of site traffic. The eastbound queues at Helmcken Road / Watkiss Way exceed the left/through and right turn lanes by several vehicles and block each other adding to the queue length in the single lane section; however, this queue does not cause any issues.
In the long-term 10-year post-development horizon (2033), at the Watkiss Way / Burnside Road intersection the westbound movement drops to LOS E in the AM under background volumes. The roundabouts at Watkiss Way / Erskine Lane and Watkiss Way / Hospital Access continue to operate well in the long-term in both peak hours. The northbound left movement at Watkiss Way / Helmcken Road continues to fail (LOS F) in both peak hours in 2033, with the southbound left and eastbound left / through at LOS E in the PM peak hour. The development does not significantly impact the traffic operations in the long term, with no changes to the intersection levels of service occurring in 2033 as a result of the addition of site traffic. The eastbound 95th percentile queues do increase with and without the development; however, the queue does not extend back to the Watkiss Way / Hospital / Eagle Creek intersection and the development adds almost no additional queue length. In the PM peak hour, under post development volumes, the northbound left turn queue is expected to exceed the northbound dual left turn lane storage (95m) by 10m; however, the outside left turn lane has an additional 10m of parallel storage that can accommodate this queue.
Assessment and adjustment of the Helmcken Road / Watkiss Way intersection may improve traffic operations; however, the impacts of changes in signal timing on queue lengths and pedestrian crossings are critical to consider.
The proposed access location is spaced appropriately from both the nearest driveway and nearest intersection and has adequate sightlines to allow drivers to easily exit the site.
This site provides easy access to the adjacent Galloping Goose Trail and to transit stops. There is also the gravel “Hospital Trail” that connects to the Hospital and transit stops to the west. At the transit stops residents would be able to access buses to all key exchanges and destinations in Greater Victoria. The 5, 7, and 9 Erskine Lane developments are expected to add bicycle and pedestrian facilities on Erskine Lane as per Town of View Royal plans.
9.0 RECOMMENDATIONS
The 10 Erskine Lane development is to extend the upgraded Erskine Way cross section on their frontage (extension of 5 Erskine, 7 Erskine, and 9 Erskine frontage improvements).
On-going monitoring of the signal timing at Watkiss Way / Helmcken Road should be undertaken by MoTI and Town of View Royal.
APPENDIX A: SYNCHRO BACKGROUND
SYNCHRO MODELLING SOFTWARE DESCRIPTION
The traffic analysis was completed using Synchro (Signal and stop-controlled intersections), SimTraffic traffic modeling software and SIDRA (for roundabout intersections). Results were measured in delay, level of service (LOS) and 95th percentile queue length. Synchro is based on the Highway Capacity Manual (HCM 2010) methodology. SimTraffic integrates established driver behaviours and characteristics to simulate actual conditions by randomly “seeding” or positioning vehicles travelling throughout the network. The simulation is run five times (five different random seedings of vehicle types, behaviours and arrivals) to obtain statistical significance of the results. SIDRA provides results using HCM 2010 methodology as well. SIDRA and Synchro uses measures of effectiveness to return the results of the analysis.
Levels of Service
Traffic operations are typically described in terms of levels of service, which rates the amount of delay per vehicle for each movement and the entire intersection. Levels of service range from LOS A (representing best operations) to LOS E/F (LOS E being poor operations and LOS F being unpredictable/disruptive operations). LOS E/F are generally unacceptable levels of service under normal everyday conditions.
The hierarchy of criteria for grading an intersection or movement not only includes delay times, but also takes into account traffic control type (stop signs or traffic signal). For example, if a vehicle is delayed for 19 seconds at an unsignalized intersection, it is considered to have an average operation, and would therefore be graded as an LOS C. However, at a signalized intersection, a 19 second delay would be considered a good operation and therefore it would be given an LOS B. The table below indicates the range of delay for LOS for signalized and unsignalized intersections.
Table A1: LOS Criteria, by Intersection Traffic Control
| Level of Service | Unsignalized Intersection Average Vehicle Delay (sec/veh) | Signalized Intersection Average Vehicle Delay (sec/veh) |
|---|---|---|
| A | Less than 10 | Less than 10 |
| B | 10 to 15 | 11 to 20 |
| C | 15 to 25 | 20 to 35 |
| D | 25 to 35 | 35 to 55 |
| E | 35 to 50 | 55 to 80 |
| F | More than 50 | More than 80 |
Document Images
(2)