Presentation
Presentation: 2021 Consolidated Financial Statements
May 3, 2022Pages 52–617 sections
Slide deck presentation summarizing the key metrics and sustainability ratios from the 2021 consolidated financial statements.
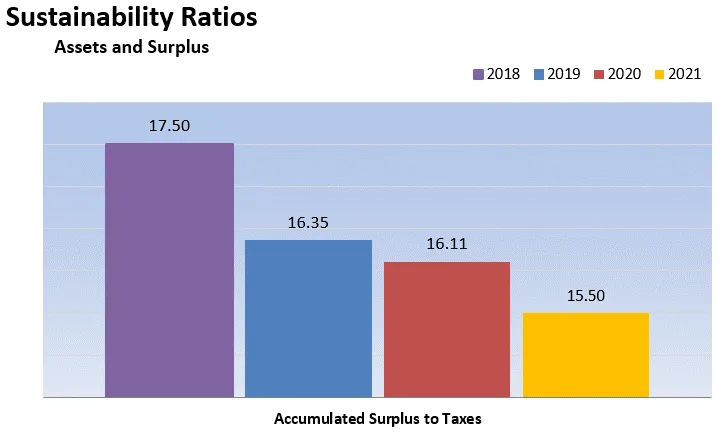
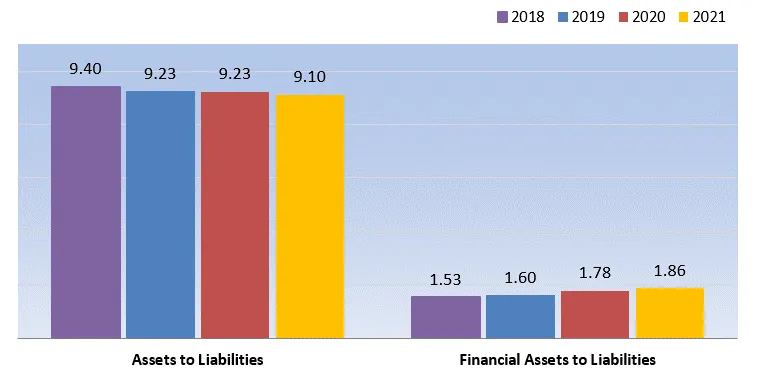
Assets to Liabilities Ratio: 1.86Financial Assets to Liabilities Ratio: 1.86Sustainability Ratio (Accumulated Surplus to Taxes): 15.50
Town of View Royal 2021 Consolidated Financial Statements
Page 52–61
Contents
- Management’s responsibility for financial reporting
- Consolidated Statements:
- Financial Position
- Operations
- Net Financial Assets
- Cash Flows
- Notes
- Segment Disclosures
- Tangible Capital Assets
- Independent Auditor’s Report
- Audit Findings Report
Page 52–61
Who does what?
Management’s responsibility
- To prepare compliant financial statements that are objective, consistent and have integrity
Auditor’s responsibility
- Conduct independent examination
- Evaluate the systems of internal control
- Express an opinion on the financial statements – do they fairly represent the actual position of the Town?
Mayor and Council’s responsibility
- Make sure management does its job
- Meet with management and auditors to review and discuss matters
Page 52–61
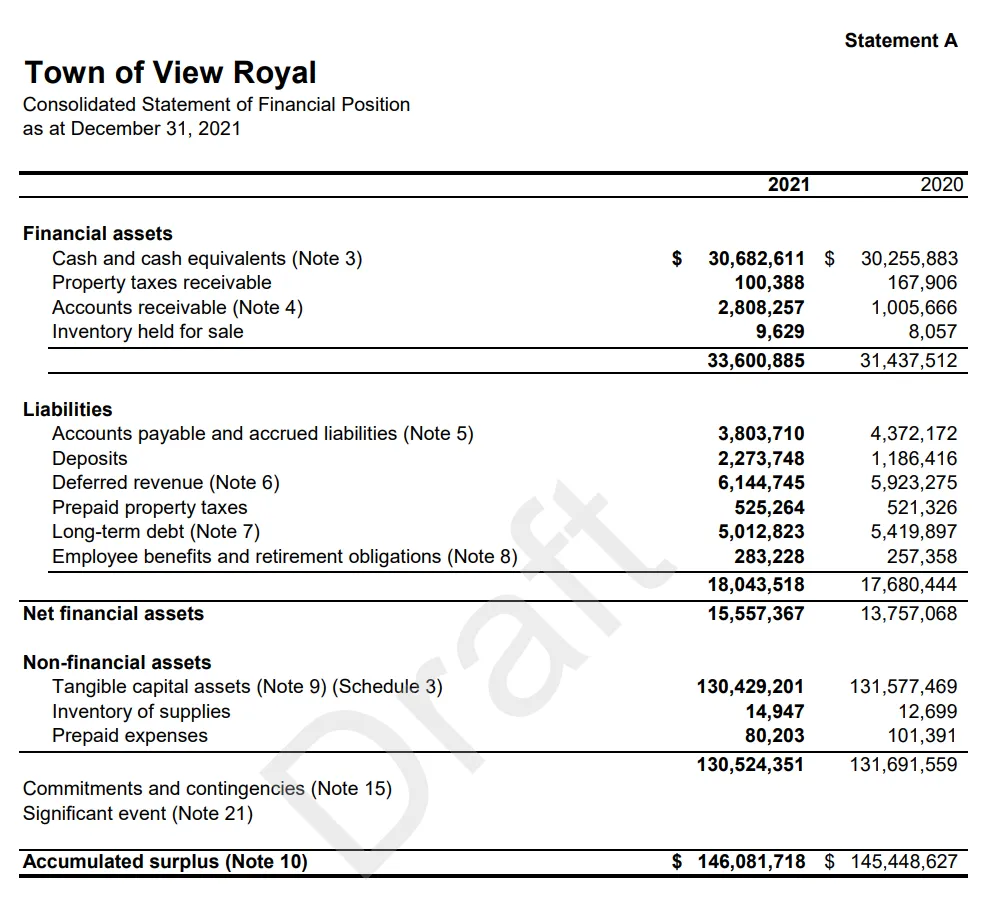
Consolidated Statement of Financial Position
aka Balance Sheet Statement A
Where are we at on December 31, 2021?
- Net financial assets (debt)
- Non-financial assets
- Accumulated surplus
Note the NOTES!
| 2021 | 2020 | |
|---|---|---|
| Financial assets | ||
| Cash and cash equivalents (Note 3) | $ 30,682,611 | $ 30,255,883 |
| Property taxes receivable | 100,388 | 167,906 |
| Accounts receivable (Note 4) | 2,808,257 | 1,005,666 |
| Inventory held for sale | 9,629 | 8,057 |
| 33,600,885 | 31,437,512 | |
| Liabilities | ||
| Accounts payable and accrued liabilities (Note 5) | 3,803,710 | 4,372,172 |
| Deposits | 2,273,748 | 1,186,416 |
| Deferred revenue (Note 6) | 6,144,745 | 5,923,275 |
| Prepaid property taxes | 525,264 | 521,326 |
| Long-term debt (Note 7) | 5,012,823 | 5,419,897 |
| Employee benefits and retirement obligations (Note 8) | 283,228 | 257,358 |
| 18,043,518 | 17,680,444 | |
| Net financial assets | 15,557,367 | 13,757,068 |
| Non-financial assets | ||
| Tangible capital assets (Note 9) (Schedule 3) | 130,429,201 | 131,577,469 |
| Inventory of supplies | 14,947 | 12,699 |
| Prepaid expenses | 80,203 | 101,391 |
| 130,524,351 | 131,691,559 | |
| Commitments and contingencies (Note 15) | ||
| Significant event (Note 21) | ||
| Accumulated surplus (Note 10) | $ 146,081,718 | $ 145,448,627 |
Sustainability Ratios
Assets and Surplus
Page 52–61
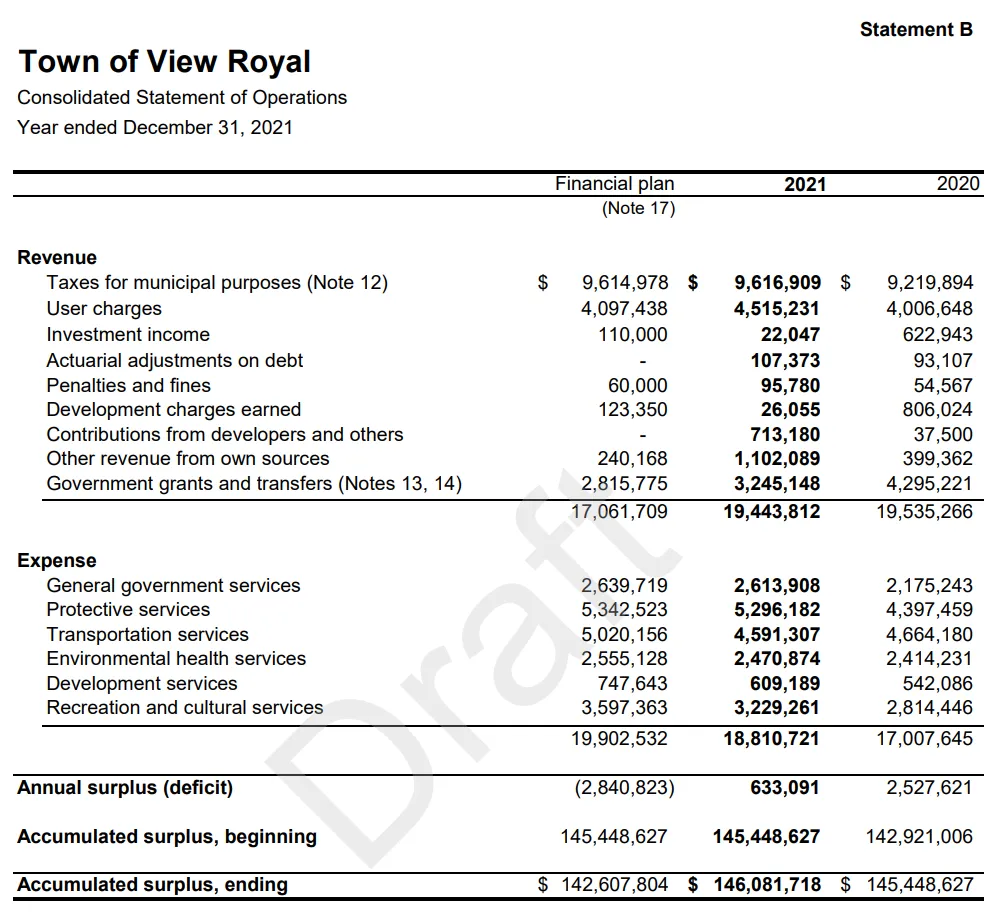
Consolidated Statement of Operations
aka: Income Statement Statement B
What happened in 2021?
- Revenue
- Expense
- Annual surplus (deficit)
- Accumulated surplus = Statement A
Sustainability Ratios
Net Financial Assets

| Financial plan (Note 17) | 2021 | 2020 | |
|---|---|---|---|
| Revenue | |||
| Taxes for municipal purposes (Note 12) | $ 9,614,978 | $ 9,616,909 | $ 9,219,894 |
| User charges | 4,097,438 | 4,515,231 | 4,006,648 |
| Investment income | 110,000 | 22,047 | 622,943 |
| Actuarial adjustments on debt | - | 107,373 | 93,107 |
| Penalties and fines | 60,000 | 95,780 | 54,567 |
| Development charges earned | 123,350 | 26,055 | 806,024 |
| Contributions from developers and others | - | 713,180 | 37,500 |
| Other revenue from own sources | 240,168 | 1,102,089 | 399,362 |
| Government grants and transfers (Notes 13, 14) | 2,815,775 | 3,245,148 | 4,295,221 |
| 17,061,709 | 19,443,812 | 19,535,266 | |
| Expense | |||
| General government services | 2,639,719 | 2,613,908 | 2,175,243 |
| Protective services | 5,342,523 | 5,296,182 | 4,397,459 |
| Transportation services | 5,020,156 | 4,591,307 | 4,664,180 |
| Environmental health services | 2,555,128 | 2,470,874 | 2,414,231 |
| Development services | 747,643 | 609,189 | 542,086 |
| Recreation and cultural services | 3,597,363 | 3,229,261 | 2,814,446 |
| 19,902,532 | 18,810,721 | 17,007,645 | |
| Annual surplus (deficit) | (2,840,823) | 633,091 | 2,527,621 |
| Accumulated surplus, beginning | 145,448,627 | 145,448,627 | 142,921,006 |
| Accumulated surplus, ending | $ 142,607,804 | $ 146,081,718 | $ 145,448,627 |
Page 52–61
Consolidated Statement of Change in Net Financial Assets
aka Change in financial equity Statement C
Takes the non-financial assets out of the annual surplus, so we have a better understanding of our net financial asset position
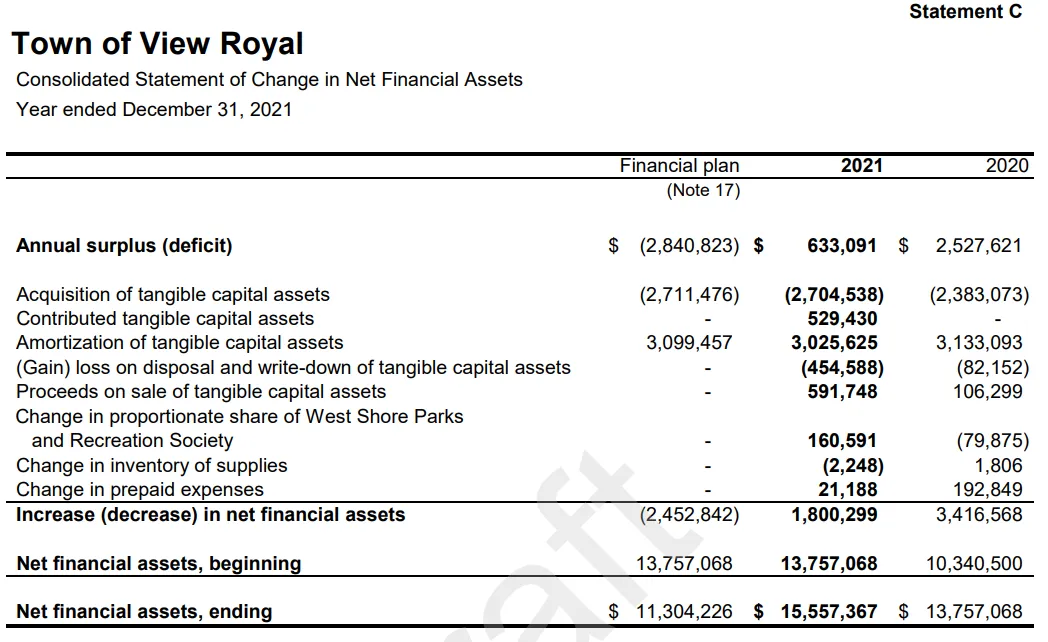
| Financial plan (Note 17) | 2021 | 2020 | |
|---|---|---|---|
| Annual surplus (deficit) | $ (2,840,823) | $ 633,091 | $ 2,527,621 |
| Acquisition of tangible capital assets | (2,711,476) | (2,704,538) | (2,383,073) |
| Contributed tangible capital assets | - | 529,430 | - |
| Amortization of tangible capital assets | 3,099,457 | 3,025,625 | 3,133,093 |
| (Gain) loss on disposal and write-down of tangible capital assets | - | (454,588) | (82,152) |
| Proceeds on sale of tangible capital assets | - | 591,748 | 106,299 |
| Change in proportionate share of West Shore Parks and Recreation Society | - | 160,591 | (79,875) |
| Change in inventory of supplies | - | (2,248) | 1,806 |
| Change in prepaid expenses | - | 21,188 | 192,849 |
| Increase (decrease) in net financial assets | (2,452,842) | 1,800,299 | 3,416,568 |
| Net financial assets, beginning | 13,757,068 | 13,757,068 | 10,340,500 |
| Net financial assets, ending | $ 11,304,226 | $ 15,557,367 | $ 13,757,068 |
Page 52–61
Consolidated Statement of Cash Flows
Statement D
Reports the change in cash and investments in the period, and how the Town financed its activities
Where did the cash come from and how was it used?
Page 52–61
Document Images
(4)


Extracted from: 2022 05 03 Council Agenda - Agenda - Pdf