2021 Consolidated Financial Statements and Audit Results
Financial statements for the Town of View Royal including cash flow statements, accounting policies, and schedules for tangible capital assets and segmented disclosure.
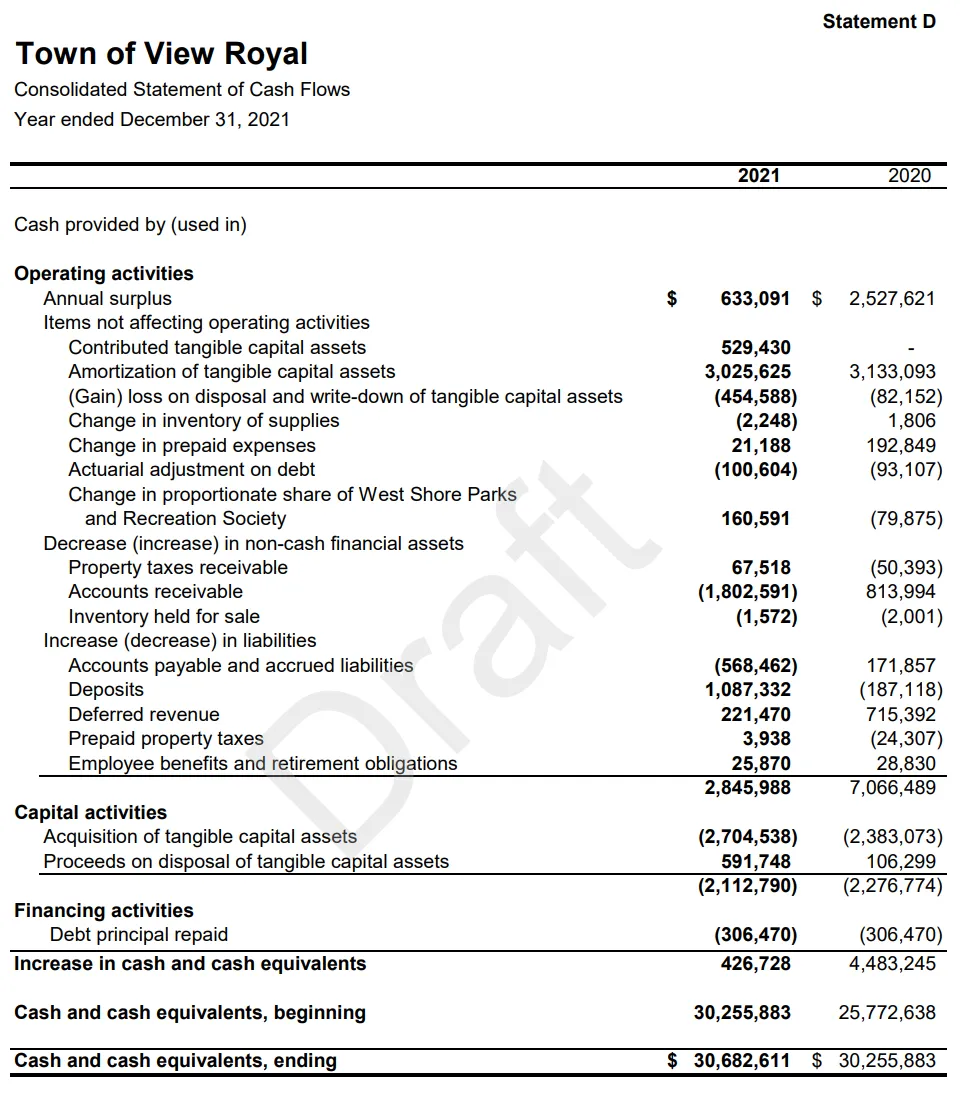
Town of View Royal
Consolidated Statement of Cash Flows
Year ended December 31, 2021
Statement D
| Cash provided by (used in) | 2021 | 2020 |
|---|---|---|
| Operating activities | ||
| Annual surplus | $ 633,091 | $ 2,527,621 |
| Items not affecting operating activities: | ||
| Contributed tangible capital assets | 529,430 | - |
| Amortization of tangible capital assets | 3,025,625 | 3,133,093 |
| (Gain) loss on disposal and write-down of tangible capital assets | (454,588) | (82,152) |
| Change in inventory of supplies | (2,248) | 1,806 |
| Change in prepaid expenses | 21,188 | 192,849 |
| Actuarial adjustment on debt | (100,604) | (93,107) |
| Change in proportionate share of West Shore Parks and Recreation Society | 160,591 | (79,875) |
| Decrease (increase) in non-cash financial assets: | ||
| Property taxes receivable | 67,518 | (50,393) |
| Accounts receivable | (1,802,591) | 813,994 |
| Inventory held for sale | (1,572) | (2,001) |
| Increase (decrease) in liabilities: | ||
| Accounts payable and accrued liabilities | (568,462) | 171,857 |
| Deposits | 1,087,332 | (187,118) |
| Deferred revenue | 221,470 | 715,392 |
| Prepaid property taxes | 3,938 | (24,307) |
| Employee benefits and retirement obligations | 25,870 | 28,830 |
| 2,845,988 | 7,066,489 | |
| Capital activities | ||
| Acquisition of tangible capital assets | (2,704,538) | (2,383,073) |
| Proceeds on disposal of tangible capital assets | 591,748 | 106,299 |
| (2,112,790) | (2,276,774) | |
| Financing activities | ||
| Debt principal repaid | (306,470) | (306,470) |
| Increase in cash and cash equivalents | 426,728 | 4,483,245 |
| Cash and cash equivalents, beginning | 30,255,883 | 25,772,638 |
| Cash and cash equivalents, ending | $ 30,682,611 | $ 30,255,883 |
Notes to Consolidated Financial Statements
aka "Notes"
- Context
- Accounting policies
- Details
- Information
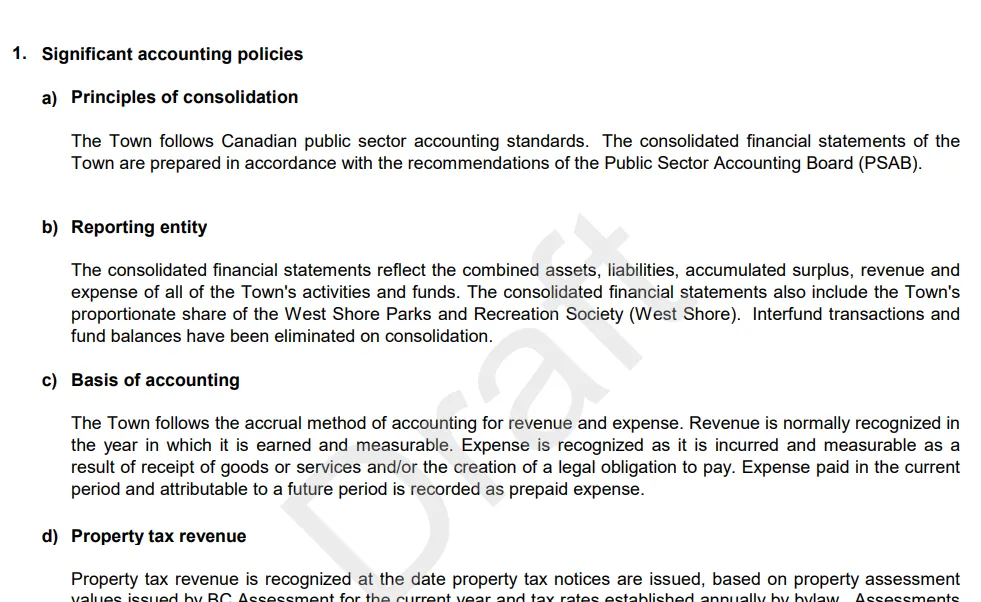
1. Significant accounting policies
a) Principles of consolidation The Town follows Canadian public sector accounting standards. The consolidated financial statements of the Town are prepared in accordance with the recommendations of the Public Sector Accounting Board (PSAB).
b) Reporting entity The consolidated financial statements reflect the combined assets, liabilities, accumulated surplus, revenue and expense of all of the Town's activities and funds. The consolidated financial statements also include the Town's proportionate share of the West Shore Parks and Recreation Society (West Shore). Interfund transactions and fund balances have been eliminated on consolidation.
c) Basis of accounting The Town follows the accrual method of accounting for revenue and expense. Revenue is normally recognized in the year in which it is earned and measurable. Expense is recognized as it is incurred and measurable as a result of receipt of goods or services and/or the creation of a legal obligation to pay. Expense paid in the current period and attributable to a future period is recorded as prepaid expense.
d) Property tax revenue Property tax revenue is recognized at the date property tax notices are issued, based on property assessment values issued by BC Assessment for the current year and tax rates established annually by bylaw.
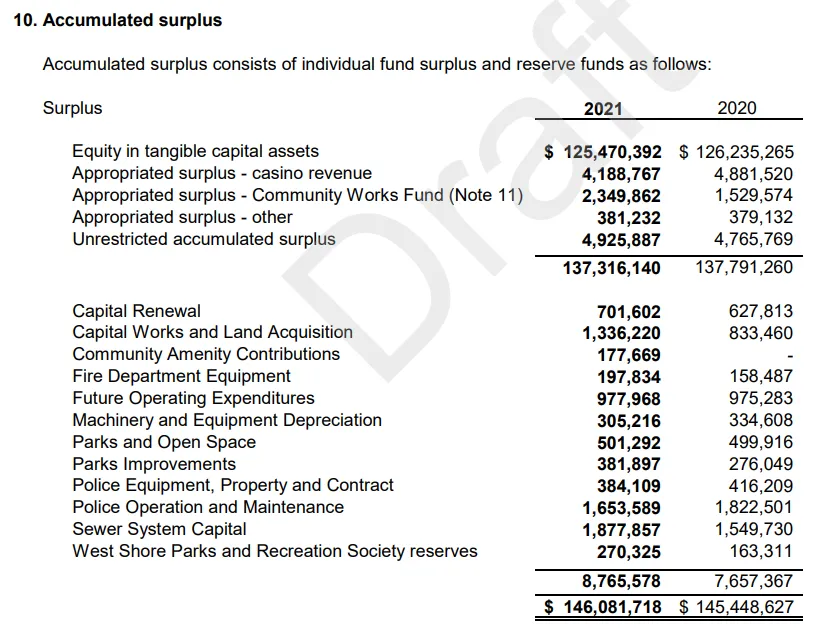
10. Accumulated surplus
Accumulated surplus consists of individual fund surplus and reserve funds as follows:
| Surplus | 2021 | 2020 |
|---|---|---|
| Equity in tangible capital assets | $ 125,470,392 | $ 126,235,265 |
| Appropriated surplus - casino revenue | 4,188,767 | 4,881,520 |
| Appropriated surplus - Community Works Fund (Note 11) | 2,349,862 | 1,529,574 |
| Appropriated surplus - other | 381,232 | 379,132 |
| Unrestricted accumulated surplus | 4,925,887 | 4,765,769 |
| 137,316,140 | 137,791,260 | |
| Capital Renewal | 701,602 | 627,813 |
| Capital Works and Land Acquisition | 1,336,220 | 833,460 |
| Community Amenity Contributions | 177,669 | - |
| Fire Department Equipment | 197,834 | 158,487 |
| Future Operating Expenditures | 977,968 | 975,283 |
| Machinery and Equipment Depreciation | 305,216 | 334,608 |
| Parks and Open Space | 501,292 | 499,916 |
| Parks Improvements | 381,897 | 276,049 |
| Police Equipment, Property and Contract | 384,109 | 416,209 |
| Police Operation and Maintenance | 1,653,589 | 1,822,501 |
| Sewer System Capital | 1,877,857 | 1,549,730 |
| West Shore Parks and Recreation Society reserves | 270,325 | 163,311 |
| 8,765,578 | 7,657,367 | |
| Total Accumulated Surplus | $ 146,081,718 | $ 145,448,627 |
Difference $633,091 = 2021 surplus
10. Accumulated surplus (continued)
[Annotations on this page:]
- Difference $160,118 = 2021 unrestricted surplus (relative to Unrestricted accumulated surplus)
- Difference $633,091 = 2021 surplus (relative to Total Accumulated Surplus)
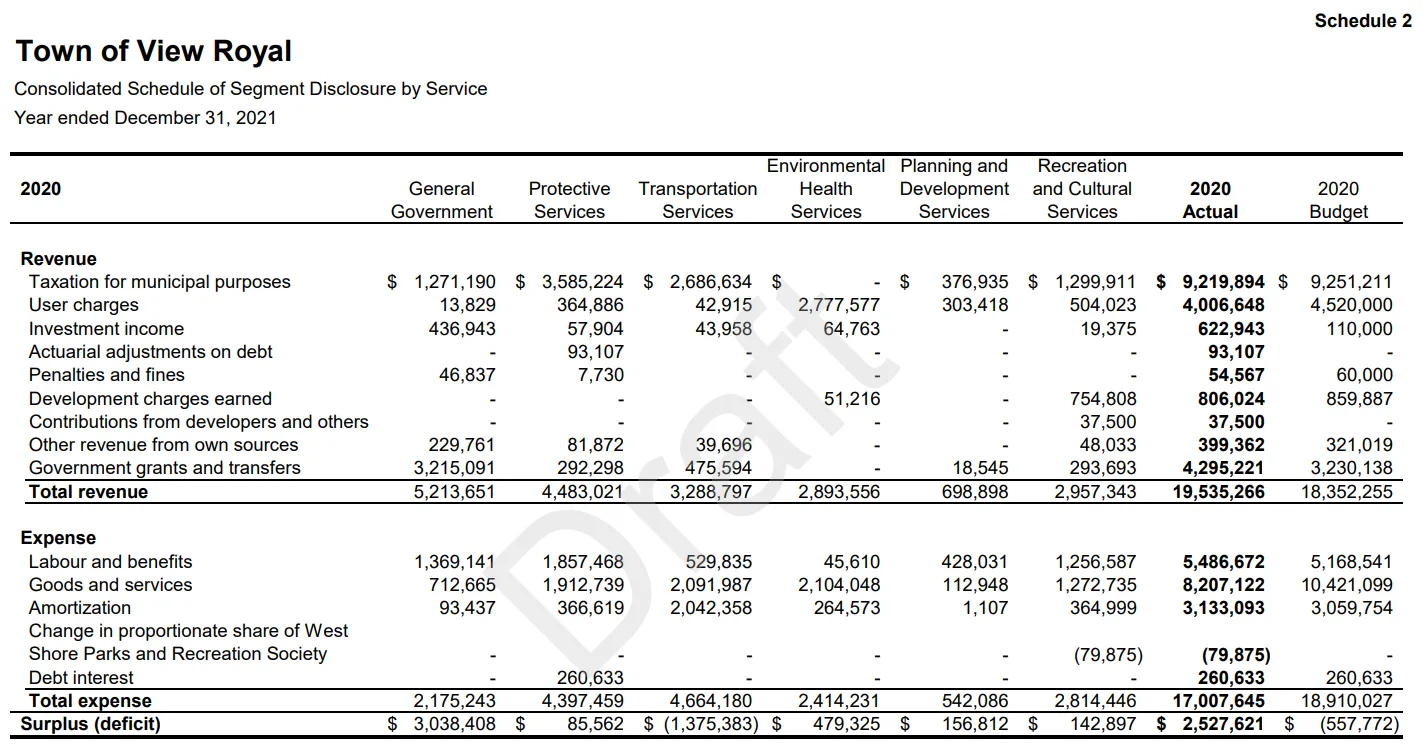
Consolidated Schedules of Segment Disclosure by Service
aka Segmented Info
- Schedule 1 (2021)
- Schedule 2 (2020)
Describes R & E categories for each function shown on Statement B
Statement B functions:
- General Government
- Protective
- Transportation
- Environmental Health
- Development
- Recreation & Culture
Scheds 1 & 2 categories:
- Labour & benefits
- Goods & services
- Amortization
- Debt interest
- WSPR change in share
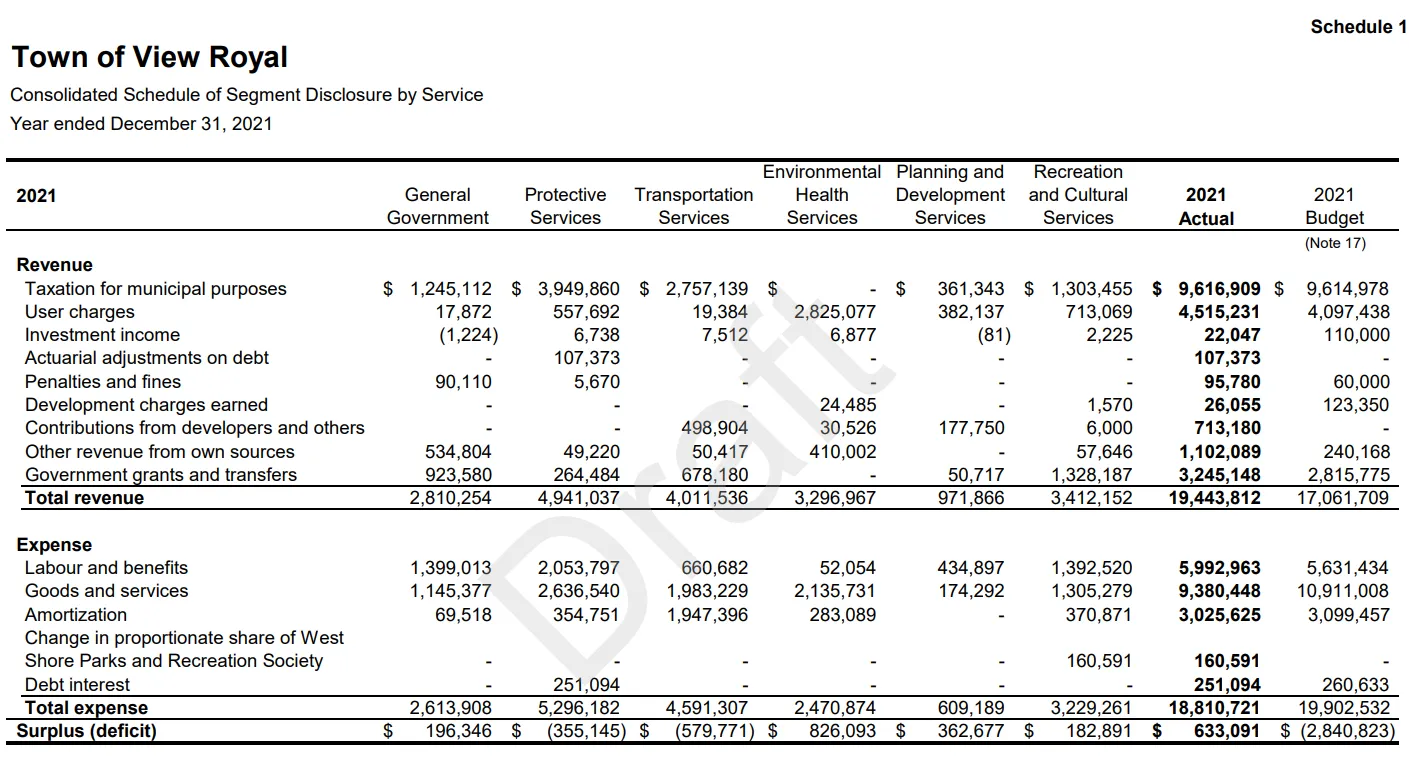
Town of View Royal
Consolidated Schedule of Segment Disclosure by Service
Year ended December 31, 2021
Schedule 1
| 2021 | General Government | Protective Services | Transportation Services | Environmental Health Services | Planning and Development Services | Recreation and Cultural Services | 2021 Actual | 2021 Budget (Note 17) |
|---|---|---|---|---|---|---|---|---|
| Revenue | ||||||||
| Taxation for municipal purposes | $ 1,245,112 | $ 3,949,860 | $ 2,757,139 | $ - | $ 361,343 | $ 1,303,455 | $ 9,616,909 | $ 9,614,978 |
| User charges | 17,872 | 557,692 | 19,384 | 2,825,077 | 382,137 | 713,069 | 4,515,231 | 4,097,438 |
| Investment income | (1,224) | 6,738 | 7,512 | 6,877 | (81) | 2,225 | 22,047 | 110,000 |
| Actuarial adjustments on debt | - | 107,373 | - | - | - | - | 107,373 | - |
| Penalties and fines | 90,110 | 5,670 | - | - | - | - | 95,780 | 60,000 |
| Development charges earned | - | - | - | 24,485 | - | 1,570 | 26,055 | 123,350 |
| Contributions from developers and others | - | - | 498,904 | 30,526 | 177,750 | 6,000 | 713,180 | - |
| Other revenue from own sources | 534,804 | 49,220 | 50,417 | 410,002 | - | 57,646 | 1,102,089 | 240,168 |
| Government grants and transfers | 923,580 | 264,484 | 678,180 | - | 50,717 | 1,328,187 | 3,245,148 | 2,815,775 |
| Total revenue | 2,810,254 | 4,941,037 | 4,011,536 | 3,296,967 | 971,866 | 3,412,152 | 19,443,812 | 17,061,709 |
| Expense | ||||||||
| Labour and benefits | 1,399,013 | 2,053,797 | 660,682 | 52,054 | 434,897 | 1,392,520 | 5,992,963 | 5,631,434 |
| Goods and services | 1,145,377 | 2,636,540 | 1,983,229 | 2,135,731 | 174,292 | 1,305,279 | 9,380,448 | 10,911,008 |
| Amortization | 69,518 | 354,751 | 1,947,396 | 283,089 | - | 370,871 | 3,025,625 | 3,099,457 |
| Change in proportionate share of West Shore Parks and Recreation Society | - | - | - | - | - | 160,591 | 160,591 | - |
| Debt interest | - | 251,094 | - | - | - | - | 251,094 | 260,633 |
| Total expense | 2,613,908 | 5,296,182 | 4,591,307 | 2,470,874 | 609,189 | 3,229,261 | 18,810,721 | 19,902,532 |
| Surplus (deficit) | $ 196,346 | $ (355,145) | $ (579,771) | $ 826,093 | $ 362,677 | $ 182,891 | $ 633,091 | $ (2,840,823) |
Town of View Royal
Consolidated Schedule of Segment Disclosure by Service
Year ended December 31, 2021
Schedule 2
| 2020 | General Government | Protective Services | Transportation Services | Environmental Health Services | Planning and Development Services | Recreation and Cultural Services | 2020 Actual | 2020 Budget |
|---|---|---|---|---|---|---|---|---|
| Revenue | ||||||||
| Taxation for municipal purposes | $ 1,271,190 | $ 3,585,224 | $ 2,686,634 | $ - | $ 376,935 | $ 1,299,911 | $ 9,219,894 | $ 9,251,211 |
| User charges | 13,829 | 364,886 | 42,915 | 2,777,577 | 303,418 | 504,023 | 4,006,648 | 4,520,000 |
| Investment income | 436,943 | 57,904 | 43,958 | 64,763 | - | 19,375 | 622,943 | 110,000 |
| Actuarial adjustments on debt | - | 93,107 | - | - | - | - | 93,107 | - |
| Penalties and fines | 46,837 | 7,730 | - | - | - | - | 54,567 | 60,000 |
| Development charges earned | - | - | - | 51,216 | - | 754,808 | 806,024 | 859,887 |
| Contributions from developers and others | - | - | - | - | - | 37,500 | 37,500 | - |
| Other revenue from own sources | 229,761 | 81,872 | 39,696 | - | - | 48,033 | 399,362 | 321,019 |
| Government grants and transfers | 3,215,091 | 292,298 | 475,594 | - | 18,545 | 293,693 | 4,295,221 | 3,230,138 |
| Total revenue | 5,213,651 | 4,483,021 | 3,288,797 | 2,893,556 | 698,898 | 2,957,343 | 19,535,266 | 18,352,255 |
| Expense | ||||||||
| Labour and benefits | 1,369,141 | 1,857,468 | 529,835 | 45,610 | 428,031 | 1,256,587 | 5,486,672 | 5,168,541 |
| Goods and services | 712,665 | 1,912,739 | 2,091,987 | 2,104,048 | 112,948 | 1,272,735 | 8,207,122 | 10,421,099 |
| Amortization | 93,437 | 366,619 | 2,042,358 | 264,573 | 1,107 | 364,999 | 3,133,093 | 3,059,754 |
| Change in proportionate share of West Shore Parks and Recreation Society | - | - | - | - | - | (79,875) | (79,875) | - |
| Debt interest | - | 260,633 | - | - | - | - | 260,633 | 260,633 |
| Total expense | 2,175,243 | 4,397,459 | 4,664,180 | 2,414,231 | 542,086 | 2,814,446 | 17,007,645 | 18,910,027 |
| Surplus (deficit) | $ 3,038,408 | $ 85,562 | $ (1,375,383) | $ 479,325 | $ 156,812 | $ 142,897 | $ 2,527,621 | $ (557,772) |
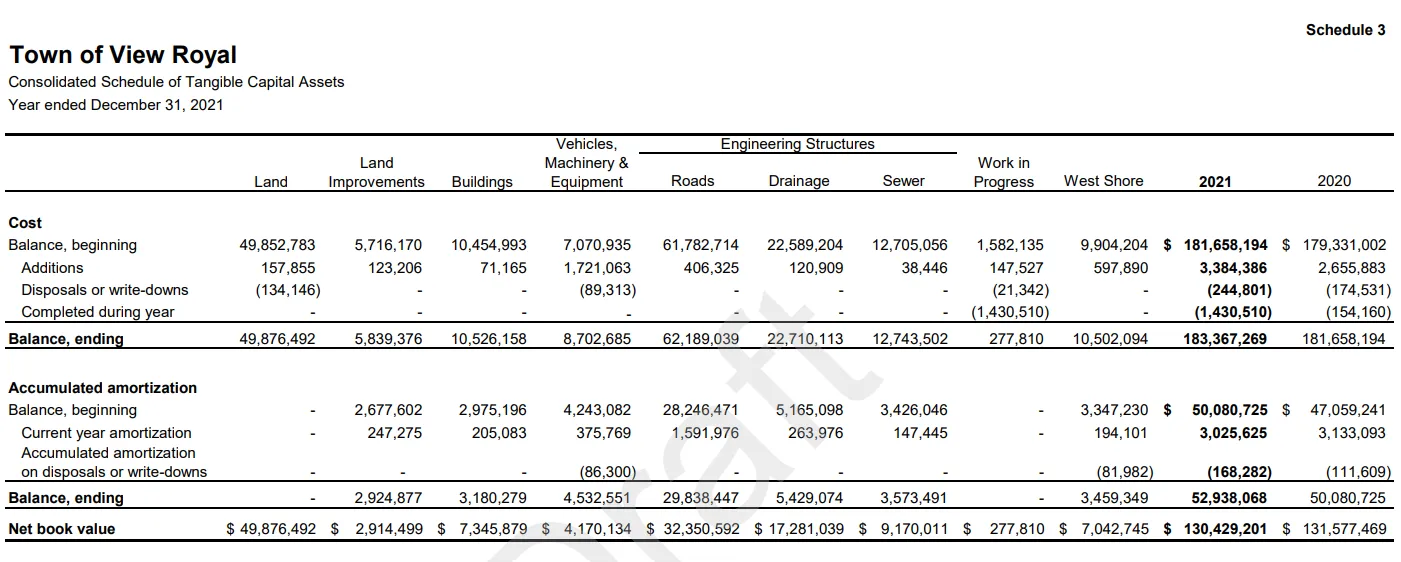
Consolidated Schedule of Tangible Capital Assets
aka TCA Schedule
Schedule 3
Details for each category of TCA:
- Historical costs
- Additions and disposals in the year
- Amortization
- Net book value
Includes prior year comparatives
Town of View Royal
Consolidated Schedule of Tangible Capital Assets
Year ended December 31, 2021
Schedule 3
| Description | Land | Land Improvements | Buildings | Vehicles, Machinery & Equipment | Engineering Structures: Roads | Engineering Structures: Drainage | Engineering Structures: Sewer | Work in Progress | West Shore | 2021 Total | 2020 Total |
|---|---|---|---|---|---|---|---|---|---|---|---|
| Cost | |||||||||||
| Balance, beginning | 49,852,783 | 5,716,170 | 10,454,993 | 7,070,935 | 61,782,714 | 22,589,204 | 12,705,056 | 1,582,135 | 9,904,204 | $ 181,658,194 | $ 179,331,002 |
| Additions | 157,855 | 123,206 | 71,165 | 1,721,063 | 406,325 | 120,909 | 38,446 | 147,527 | 597,890 | 3,384,386 | 2,655,883 |
| Disposals or write-downs | (134,146) | - | - | (89,313) | - | - | - | (21,342) | - | (244,801) | (174,531) |
| Completed during year | - | - | - | - | - | - | - | (1,430,510) | - | (1,430,510) | (154,160) |
| Balance, ending | 49,876,492 | 5,839,376 | 10,526,158 | 8,702,685 | 62,189,039 | 22,710,113 | 12,743,502 | 277,810 | 10,502,094 | 183,367,269 | 181,658,194 |
| Accumulated amortization | |||||||||||
| Balance, beginning | - | 2,677,602 | 2,975,196 | 4,243,082 | 28,246,471 | 5,165,098 | 3,426,046 | - | 3,347,230 | $ 50,080,725 | $ 47,059,241 |
| Current year amortization | - | 247,275 | 205,083 | 375,769 | 1,591,976 | 263,976 | 147,445 | - | 194,101 | 3,025,625 | 3,133,093 |
| Accumulated amortization on disposals or write-downs | - | - | - | (86,300) | - | - | - | - | (81,982) | (168,282) | (111,609) |
| Balance, ending | - | 2,924,877 | 3,180,279 | 4,532,551 | 29,838,447 | 5,429,074 | 3,573,491 | - | 3,459,349 | 52,938,068 | 50,080,725 |
| Net book value | $ 49,876,492 | $ 2,914,499 | $ 7,345,879 | $ 4,170,134 | $ 32,350,592 | $ 17,281,039 | $ 9,170,011 | $ 277,810 | $ 7,042,745 | $ 130,429,201 | $ 131,577,469 |
Flexibility Ratios
Revenues and Assets

Tangible Capital Assets-NBV to Cost:
- 2018: 0.75
- 2019: 0.74
- 2020: 0.72
- 2021: 0.71
Own Source Revenues to Taxes:
- 2018: 0.50
- 2019: 0.46
- 2020: 0.56
- 2021: 0.61
Debt Charges
Public Debt Charges to Revenues:
- 2018: 1.36%
- 2019: 1.52%
- 2020: 1.33%
- 2021: 1.29%
Vulnerability Ratios
Government Transfers

Government Transfers to Total Revenue:
- 2018: 0.17
- 2019: 0.22
- 2020: 0.22
- 2021: 0.17
Document Images
(3)

