Presentation
WSPR 2024 – 2028 FINANCIAL PLAN PRESENTATION
January 16, 2024Pages 69–8818 sections
Presentation slide deck for the West Shore Parks & Recreation 2024-2028 Financial Plan provided to the Town of View Royal.
January 16th, 20242023 Surplus projection: $445,487View Royal ownership share: 12.71%41,671 rounds of golf played in 2023
2024 – 2028 FINANCIAL PLAN
Town of View Royal
January 16th, 2024
Page 69–88
Today’s presentation includes:
- 2023 program highlights and statistics
- 2023 financial projections and major variances
- 2024 budget considerations
- 2024 major expense increases
- 5-Year financial plan 2024-2028
- Summary of the 2024 capital projects
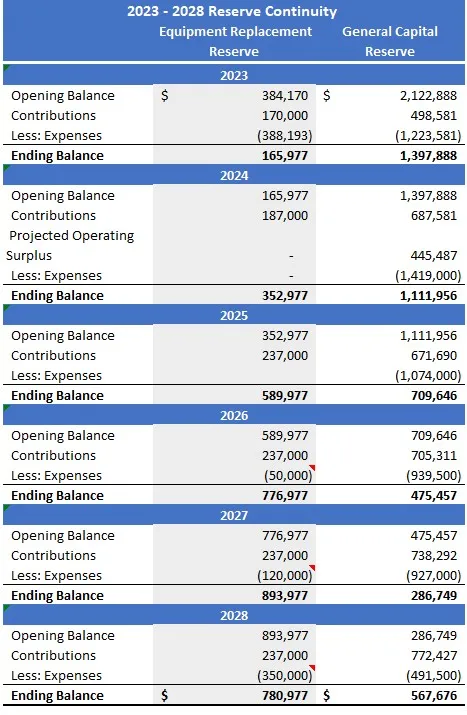
- 5-Year Reserve Continuity
- Requisition impact to each municipality
- Future Considerations
Page 69–88
2023 Program Highlights:
Swimming Lessons
- 2023: 1,573 lessons to 5,411 swimmers
- 2022: 981 lessons to 3,425 swimmers

Skating Lessons
- 2023: 265 classes to 1,180 skaters
- 2022: 266 classes to 1,073 skaters
Facility Rentals
- 2023: 4,953 field hours, 3,864 ice hours, 4,242 pool hours
- 2022: 4,762 field hours, 3,551 ice hours, 4,117 pool hours
Page 69–88
2023 Program Highlights cont.:
Rounds of Golf
- 2023: 41,671 rounds
- 2022: 35,497 rounds

Single and Visit Pass Admissions
- Fitness: 55,869 in 2023 vs. 44,276 in 2022
- Pool: 70,282 in 2023 vs. 66,516 in 2022
- Skating: 10,334 in 2023 vs. 7,753 in 2022
- Youth Nights: 96/night in 2023 vs. 85/night in 2022
Annual Memberships
- 2023: 2,611 sold – 121,906 scans
- 2022: 1,376 sold – 81,053 scans
Page 69–88
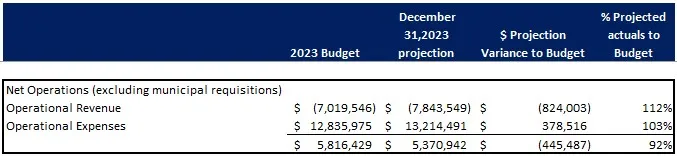
2023 Projection
Page 69–88
2023 Projection Major Variances
| Major Variances | Amount ($) | Comments |
|---|---|---|
| Aquatics | 133,330 | Improved Admissions |
| Facility Bookings | 116,705 | Increase demand for field and room rentals |
| Parks & Maintenance | 111,530 | Vacant positions |
| Golf | 89,270 | More rounds played |
| Childcare | 67,805 | Daycare full and afterschool care 95% full |
| Fitness & Wellness | 31,810 | Improved Admissions |
| Finance | (86,300) | Higher insurance; higher credit card transaction fees |
| Total Unspent (Deficit) | $445,487 | Net operation for 2023 |
Page 69–88
2024 Budget Considerations
- Collective agreement negotiations, currently 4% behind the region, set to increase an additional 3% in 2024.
- 10% Insurance premium increase, market rate is increasing for large insured properties.
- 5 – 10% Utility rate increases.
- Increased workload on human resources as recruitment remains a high priority.
- Continuing annual increases to capital asset reserve contributions.
Page 69–88
2024 Major Expense Increases
- Non-discretionary - $163,182
- Utility increases
- Insurance premium increases

- Discretionary – $702,638
- Wage contingency in preparation for our next round of negotiation
- Increased transfers to capital reserves
- New HR Specialist position that provides hiring support
- Overall, the total expense increase is $1,067,681. We increased our fees, program offerings and performance expectations by $834,024.
- A requisition increase of $232,657 or 4% to compensate the difference. The 2023 increase was 5% or $277,048.
Page 69–88
5-Year Financial Plan 2024-2025
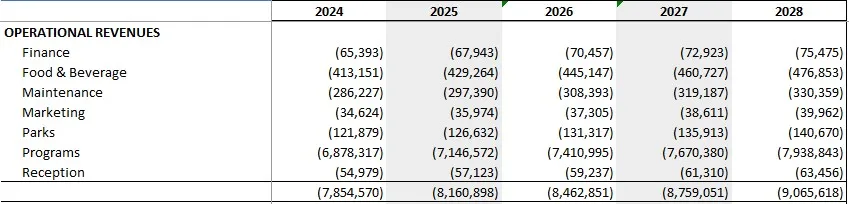
- 2024 revenue budget is $835,023 or 11.9% higher than 2023’s $7,019,547.
- Includes an average fee increase of 4% on programs, rentals and admissions
- 3.5% increase year over year in future years
Page 69–88
5-Year Financial Plan 2024-2028
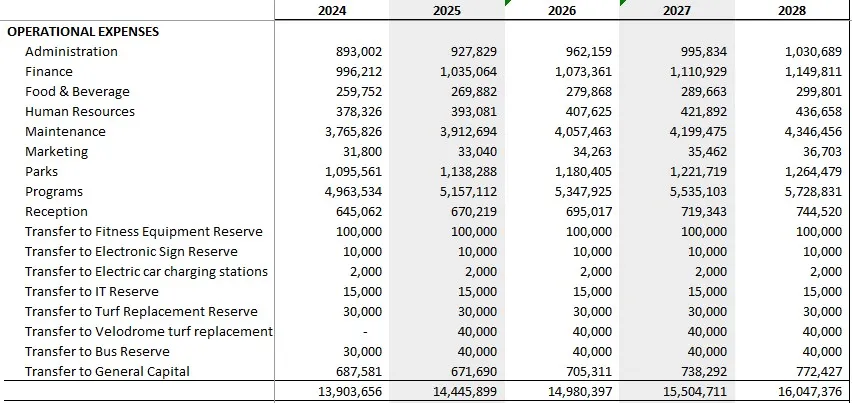
- 2024 expense budget is $1.07 million or 8.3% higher than 2023’s $12,835,975.
- 3.5% increase year over year in future years
Page 69–88
2024 Capital Projects
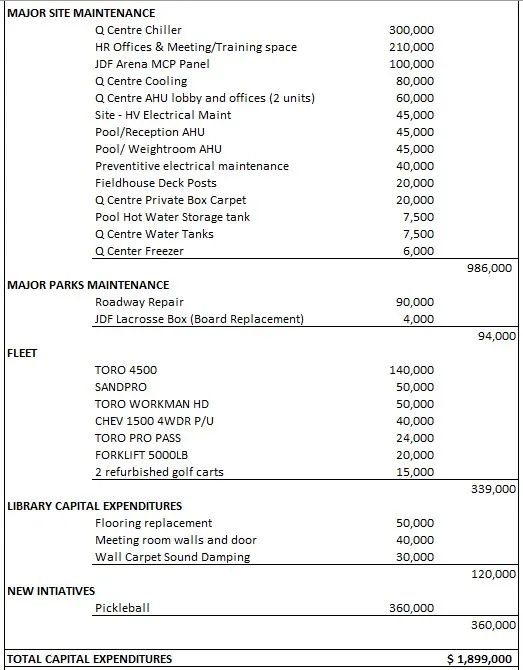
Note: the pickleball project is subject to securing grant funding which is included in the Grant, Community and Member Contributions value under Capital Funding.
Page 69–88
Reserve Continuity
Page 69–88
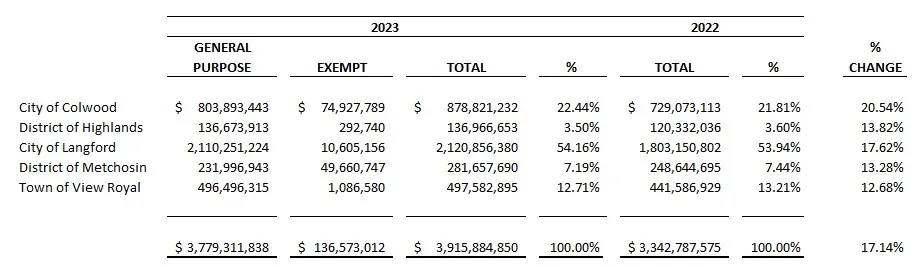
Converted Assessments
Page 69–88
2024 Requisition
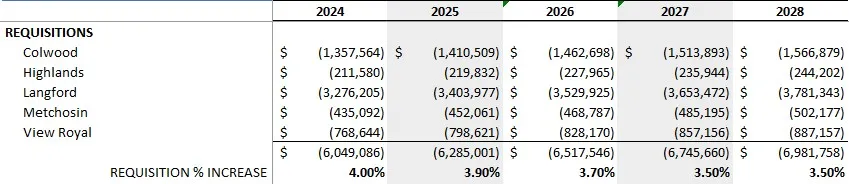
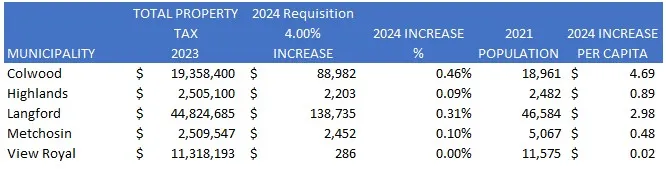
- $232,657 or 4% increase proposed for 2024 - $286 or 0.04% increase for View Royal
- 2.33% or $135,657 for operating
- 1.67% or $97,000 for additional annual capital reserve contribution which includes the $60,000 annual increase requested by owners which began in 2021
- Requisition increases are in line with approved 5-Year plan and decreasing year over year.
Page 69–88
2024 Estimated Taxation Impact
Reference Materials
- 2021 Canadian Census
- 2023-2027 Municipal Financial Plans
Page 69–88
Future Outlook
- GOVERNANCE AGREEMENTS
- Term: March 1st, 2020 – February 28th, 2025
- Recreation and Community Services Agreement
- Operating, Maintenance and Management Agreement
- 2024 Strategic Priority
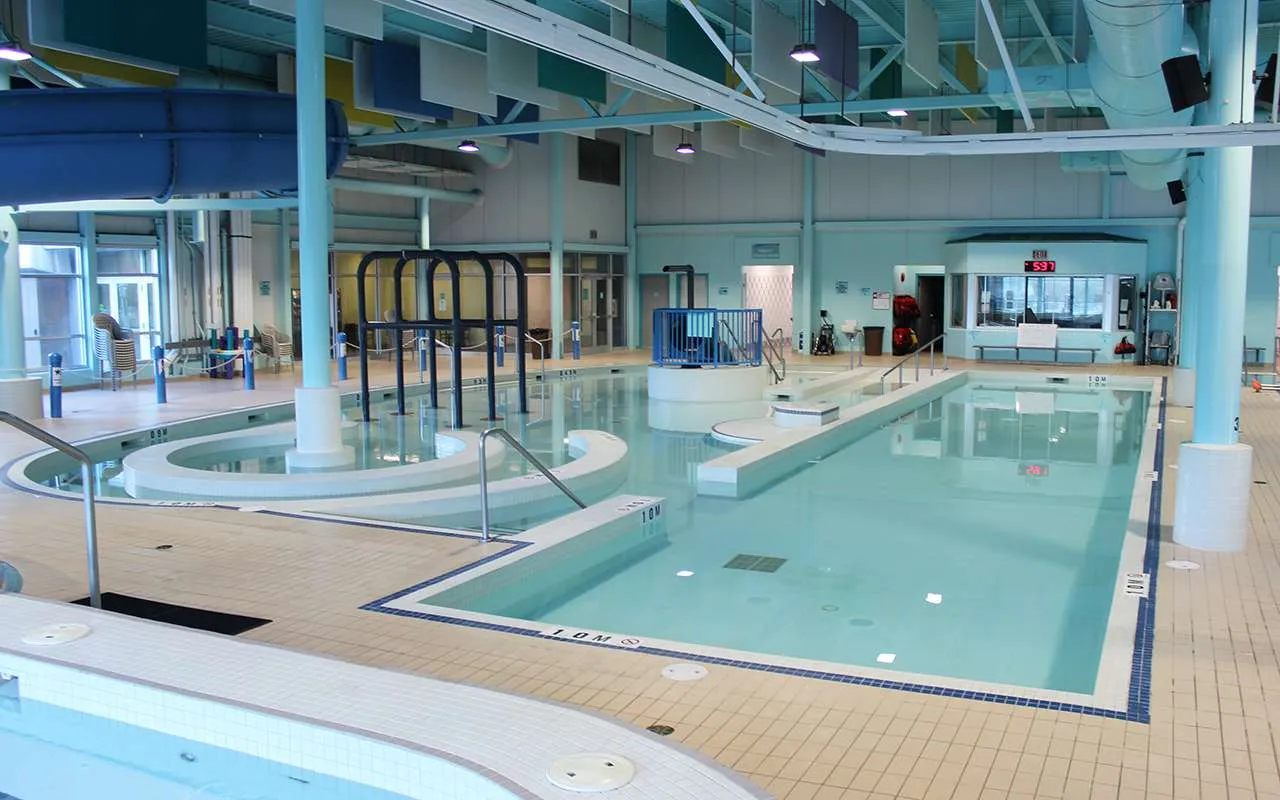
- Aging Aquatic Facility
- 2024 Consultant
Page 69–88
View Royal Overview
- Ownership 12.71%
- 1,524 or 10.88% Clients
- 490 or 11.08% Memberships
- 1,765 or 10.26% Registrations
- 17,687 or 13.20% Admissions
- 99 or 12.06% LIFE Clients
- 12.41% of all Transactions

Page 69–88
Partnership and Engagement


Page 69–88


Extracted from: 2024 01 16 Council Agenda - Agenda - Pdf