Appendix
Schedule C: 2019 Taxation Requirement Details
March 19, 2019Page 291 section
A breakdown of the components driving the 2019 tax increase, including labor costs and revenue from new construction.
$295,408 increase in labor costs (Employer Health Tax impact)3.5% total 2019 tax increase required
Schedule C 2019 Taxation Requirement Details
2019-2023 Financial Plan Approval
| Description | Amount | % Change |
|---|---|---|
| Estimated property taxes at 2018 rates (based on Completed Roll) | ||
| 2018 property taxation | $ 8,147,788 | |
| 2019 non-market change (NMC) | 245,994 | |
| 2019 property taxation at 0% increase | 8,393,782 | |
| Taxation increase required for core operating budget | ||
| Increase in labour costs (including new Employer Health Tax) | 295,408 | 3.5% |
| Decrease in costs of other core expenses | (11,228) | (0.1%) |
| Decrease in revenue estimates | 55,894 | 0.7% |
| Decrease in transfers from reserves and surplus | 101,265 | 1.2% |
| Increase in transfers to reserves | 61,189 | 0.7% |
| Total taxation increase required for core operating budget | 502,528 | 6.0% |
| Taxation increase required for non-core requests and operational cost of capital | 38,625 | 0.4% |
| Total taxation increase required | 541,153 | 6.4% |
| Revenue from new construction | (245,994) | 2.9% |
| 2019 tax increase required | 295,159 | 3.5% |
| 2019 total taxation revenue | $ 8,688,941 |
The first calculation in the table above demonstrates if there were no changes to the tax rates in 2019 a total of nearly $8.4 million would be raised. Each 1% increase equates to approximately $84,000 in tax revenue. This financial plan estimates a 3.5% tax increase is required to fund core services, including the new Employer Health tax and non-core requests.
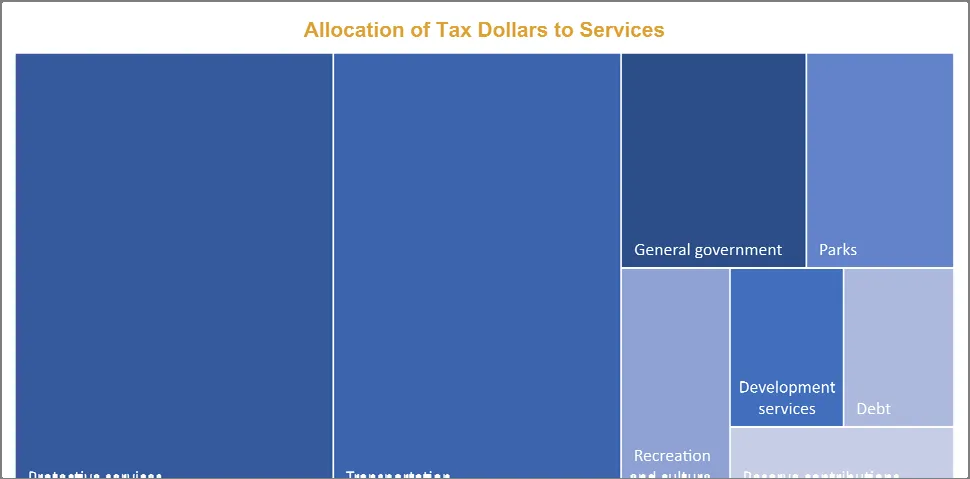
Nearly $0.65 out of every tax dollar funds protective and transportation services, while $0.10 funds general government services including support to Council and overall corporate administration.
Page 29
Extracted from: 2019 03 19 Council Agenda - Agenda - Pdf