Attachment 16. Stormwater Management Plan - Associated Engineering
Comprehensive stormwater management plan for the West Park at Thetis development.
REPORT
Limona Group
West Park at Thetis Stormwater Management Plan SWMP
SEPTEMBER 2019

TABLE OF CONTENTS
| SECTION | PAGE NO. | |
|---|---|---|
| Table of Contents | i | |
| 1 | Introduction | 1 |
| 2 | Project Description | 1 |
| 2.1 | Existing Conditions | 1 |
| 2.2 | Proposed Development Condition | 2 |
| 3 | Design Criteria | 2 |
| 3.1 | Assumptions | 3 |
| 4 | Analysis | 3 |
| 4.1 | Piped System | 3 |
| 4.2 | Detention Storage | 4 |
| 4.3 | Stormwater Treatment | 7 |
| 5 | Erosion and Sediment Control | 7 |
| Closure | ||
| Appendix A – Design Calculations |
1 INTRODUCTION
Associated Engineering has been retained by Limona Group Ltd. to design the civil site servicing for the construction of an approximately 2.6 hectare residential apartment development in the Town of View Royal, BC. As part of this scope of work, we developed a draft Stormwater Management Plan (SWMP) to support the detailed design of the stormwater network. The SWMP outlines the existing and proposed land uses, design criteria and assumptions, and the proposed works to effectively manage stormwater on the site. This report builds on previous reporting provided by Associated Engineering in December 2018, entitled “Limona Construction Ltd. – Thetis Vale Phase 8 Conceptual Stormwater Management Assessment” (AE Assessment). Note that the values provided in this report are preliminary and may be updated as detailed design progresses.
2 PROJECT DESCRIPTION
2.1 Existing Conditions
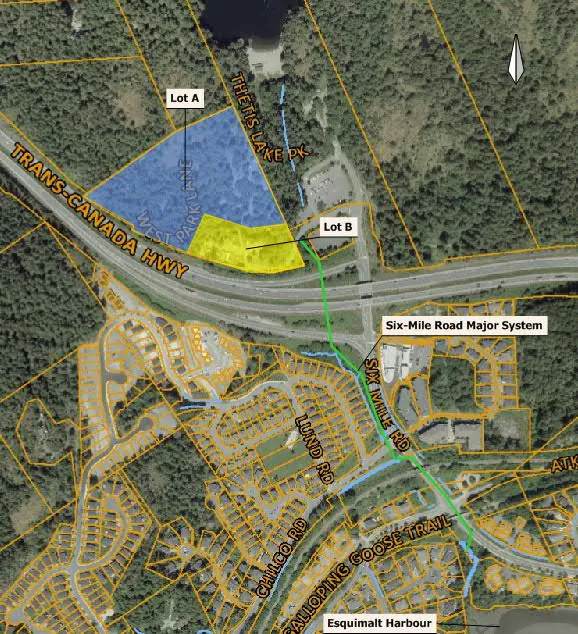
Located at the north end of Six Mile Road off of West Park Lane, the project site is adjacent to the parking lot for Thetis Lake regional Park and encompasses the Thetis Lakes Campground and RV Park. The existing development is being subdivided into two distinct project sites. The Limona Group development is larger and sits on the upland areas of the lot (Lot A). A separate project by Seymour Pacific Projects is located in Lot B to the south. Lot A is the focus of this report. See Figure 2-1.
The entire existing site (including both lots) is approximately 4 ha in area with a campground and RV park as the historical main land use. The site is roughly triangular with the southern property boundary fronting the Trans-Canada Highway. To the northeast is the Thetis Lake Regional Park parking lot and to the west is a forested area of Thetis Lake Regional Park.
Lot A is situated on the northern and western side of the property and is approximately 2.6 ha in area. It is steep and heavily forested with significant rocky outcrops. Limited existing paving and impervious areas are present in the form of trailer pads and roadways for RV access and parking. There are a few structures and outbuildings that were part of the previous campground and RV park.
North of Lot A are Lower Thetis Lake and Thetis Lake known as the Thetis Lakes. Although historically these lakes likely discharged to the south near the project area and to Esquimalt Harbour, these lakes have been dammed and now discharge to the north east towards Prior Lake before ultimately discharging to Craigflower Creek. As a result, the Thetis Lakes are outside of consideration for this project.
Lot A has little existing storm infrastructure with runoff discharging overland to the ditch on the north side of the highway and to the south east into an existing culvert and pipe system crossing the highway. The piped system conveys flows down Six Mile Road and ultimately discharges into Esquimalt Harbour.
2.2 Proposed Development Condition
Lot A will see the construction of several multi-family residential complexes and two condominium buildings over two phases. The first phase includes only multi-family quadplex and quintuplex homes. The second phase features the condominium buildings and additional quadplex and quintuplex homes. All buildings will be serviced by new sanitary, water, and drainage connections and their respective pipe networks. The existing roads and infrastructure will be removed, and the site regraded to facilitate the new buildings.
A storm network will be installed under the roads to provide conveyance of the minor storm event. Inlets to this system include catch basins for road runoff and storm connections to individual buildings for roof runoff and perimeter drains. Lawn basins installed in landscaped areas will also discharge to this system.
Overall, the site imperviousness will increase when compared to the existing condition. This will cause more runoff and a higher peak flow for a given storm event. However, significant regrading of the steep slopes will lower the average slope of the site and serve to attenuate peak flows. To compensate for these changes in hydrologic response, detention storage will be included to minimize potential downstream impacts of increased peak flows.
Frequent rainfall events will be routed through stormwater treatment devices such as an oil-grit separator (OGS) to remove pollutants including oils and suspended solids.
3 DESIGN CRITERIA
We reviewed several bylaws, guidelines, and reports to establish the appropriate design criteria for the proposed development. We reviewed the following documents:
- Town of View Royal Subdivision and Development Servicing Bylaw No. 985, 2017 (ToVR Bylaw)
- Town of View Royal Storm Water Regulation Bylaw No. 902, 2015
- Master Municipal Construction Documents Design Guidelines, 2014
- Town of View Royal – Phase 2 Transportation Assessment and Master Drainage Plan – Atkins Local Planning Area by Stantec Inc., 2003 (Stantec Report)
- Town of View Royal – Master Drainage Plan Update 2017 by Aplin Martin, 2017
Based on these documents as well as discussions with staff from the Town of View Royal (ToVR), we have developed the following design criteria.
Table 3-1: Design Criteria Summary
| Design Component | Criteria | Comments |
|---|---|---|
| Minor System (catch basins, storm pipes, etc.) | Hydraulic Grade Line (HGL) of the 10-year return period design event remains below ground surface | As per ToVR Bylaw |
| Major System (overland flow routes) | Safe overland conveyance of 100-year return period peak flows without damaging public or private infrastructure or property | As per ToVR Bylaw |
| Detention Storage | Provide storage to match the peak runoff from the 24 hour post-development 10-year event to the pre-development 10-year return period event. | Based on discussions with ToVR staff. |
| Stormwater Quality | Net annual removal of Total Suspended Solids of 60%. | Typical best practice. 60% is practical maximum removal efficiency without filtration. |
Note that all hydrologic calculations are based on the Victoria Gonzales Heights rain gauge Intensity Duration Frequency (IDF) curve as per the ToVR Bylaw.
3.1 Assumptions
3.1.1 Downstream System Capacity
Based on our previous analysis (AE Assessment) as well as the Stantec Report, we believe the downstream pipe system along Six Mile Road has a capacity to receive flows potentially up to the 200-year return period pre-development event. We have assumed that the downstream system would have capacity to receive runoff from the 10-year return period, pre-development storm event from our site as this is the runoff currently leaving Lot A and is the minor system design event specified in the ToVR Bylaw.
4 ANALYSIS
4.1 Piped System
To design the site’s piped storm system, we used a spreadsheet that calculated peak design flows based on the rational method. Each manhole to manhole pipe length was assigned a catchment area and runoff coefficient based on the proposed land use. The following hydrologic and hydraulic parameters were used for analysis.
| Parameter | Value | Comments |
|---|---|---|
| Time of Concentration (initial) | 8 minutes | MMCD Design Guidelines |
| Runoff Coefficient | 0.6 for buildings 0.5 for forested areas |
MMCD Design Guidelines |
| Pipe Roughness | 0.013 | PVC or Concrete pipe |
The pipes were sized to a maximum of 80% full flow. The HGL was estimated using Manning’s equation and assuming full pipe flow. Due to the steep gradient, backwatering is not expected at the downstream discharge point or throughout the proposed system. All service connections will enter the system above the peak HGL to avoid the possibility of surcharging into the perimeter drains.
We note that the sewer sizing presented in this report is preliminary and may change through the development of the design. See Appendix A for detailed calculations.
4.2 Detention Storage
To estimate the detention storage volume required to offset the hydrologic changes on the site, we used a lumped catchment, PCSWMM hydrologic model (version 7.2780 running SWMM5.1.012) to create hydrographs of the runoff response of the site. A lumped catchment model uses a single subcatchment with hydrological parameters averaged across the site. This provides subcatchment-wide results for peak runoff and storage requirements and is appropriate for relatively small sites such as Lot A. We created models to represent the existing catchment condition as well as the future condition by assigning varying values for different hydrologic parameters. The post-development condition models also included a storage node and orifice arrangement to assess various detention storage options for further design.
Changes to imperviousness represent a critical piece of the assessment. To asses imperviousness in the pre-development and post-development conditions, we reviewed aerial orthophotos and traced areas of different land covers (trees, paved, grass, etc.). We then assigned an imperviousness value to these and used a weighted average to estimate the imperviousness of the entire catchment.
Using the Victoria Gonzales IDF curve data, we created a design storm based on the SCS Type 1A design storm as this is a representative storm for BC coastal areas. We input the following parameters into our models.
Table 4-1: Model Input Parameter Summary
| Parameter | Existing Condition | Proposed Condition |
|---|---|---|
| Design Storm Precipitation (10-year return period 24 hour storm) | 75.3 mm | 75.3 mm |
| Catchment Area | 24,850 m² (2.49 ha) | 24,850 m² (2.49 ha) |
| Imperviousness | 14.9% | 72% |
| Average Slope | 28.0% | 7.0% |
| Maximum Flow Length | 350 m | 100 m |
| Infiltration Rate (Horton Method) | Max: 0.1 mm/hr Min: 0.05 mm/hr |
Max: 0.1 mm/hr Min: 0.05 mm/hr |
| Depression Storage | Impervious: 2 mm Pervious: 3 mm |
Impervious: 2 mm Pervious: 3 mm |
| Amount of Zero Impervious Depression Storage | 25% | 25% |
| Manning’s roughness | Impervious Surfaces: 0.018 Pervious Surfaces: 0.4 |
Impervious Surfaces: 0.018 Pervious Surfaces: 0.4 |
| Orifice Discharge Coefficient | 0.6 | 0.6 |
Note that the total catchment area used for sizing the piped system (approximately 2.6 ha) is slightly larger than that used for the detention storage models (approximately 2.5 ha). This is because the detention storage calculation is based on the hydrological changes to the existing catchment area (slope, imperviousness, etc.). Areas that are not changing, such as forested areas that will drain into Lot A, have not been included in the detention storage calculation, but are included in the pipe sizing calculation as they will contribute flows to the conveyance system.
The parameters for the pre-development condition were assigned to a single catchment and the model run to estimate the peak runoff for a given design storm. We then updated the parameters to represent the post-development condition and included a stormwater storage node and flow control orifice. Using an iterative method, we matched the post-developed peak runoff rate to the pre-development runoff rate by adjusting the orifice diameter. The required storage was then determined. See Figure 4-1.

Based on our analysis, we have determined 114 m³ of storage is required to control peak flows to pre-development conditions on-site for the 10-year return period design event. Results are summarized in Table 4-2.
Table 4-2: Site Runoff and Detention Storage Summary
| Parameter | Value |
|---|---|
| 10-year Pre-Development Peak Flow | 67.6 L/s |
| 10-year Post-Development Peak Unattenuated Flow | 81.2 L/s |
| 10-year Post-Development Peak Attenuated Flow (through Orifice) | 66.9 L/s |
| Orifice Diameter | 165 mm |
| Peak Storage Volume Provided | 114 m³ |
Note that the storage volume in Table 4-2 is based on using a rectangular storage facility with a bottom area of approximately 78 m².
4.3 Stormwater Treatment
To meet ToVR Bylaws, we have specified an OGS unit to treat runoff from the site. The OGS is intended to remove pollutants from runoff through hydrodynamic separation. The OGS is sized to remove pollutants on a net annual removal basis. Recognizing that most rainfall events that occur are much less intense than the design return period event, this approach assesses the cumulative ability of the OGS to remove pollutants across the spectrum of storms. It has a higher removal efficiency for less intense storms and a lower removal efficiency for more intense storms.
In this way, the “first flush” of runoff after a typical rainfall event is targeted. This initial runoff from the storm event usually contains the highest concentration of pollutants and sediments. More extreme events are diverted past the OGS to avoid re-suspending captured sediments, and also because this runoff has a lower concentration of pollutants. We note that some OGS units feature an internal bypass capability which removes the need for external bypass and diversion structures.
The treatment unit is expected to achieve approximately a 60% reduction in Total Suspended Solids. This is a practical maximum for hydrodynamic separation units based on the Canadian Environmental Technology Verification (ETV) particle size distribution, which was selected for sizing. The design values are summarized in Table 4-3. The appropriate OGS will specified in the design drawings.
Table 4-3: Stormwater Treatment Summary
| Parameter | Value |
|---|---|
| Peak Water Quality Flow (72% of 2-year) | 43 L/s |
| 10-year Bypass Flow | 93 L/s |
5 EROSION AND SEDIMENT CONTROL
The protection of water quality in watercourses is required by legislation in several levels of government in Canada including the Town of View Royal. This is especially important to consider during the construction of new development. During construction, disturbed areas with exposed subgrades can more easily be eroded in rainfall events than undisturbed areas that tend to have protective vegetation. The erosion of sediments can have negative impacts on downstream water bodies and the aquatic life that lives within them. In addition, the sediment can infill downstream storm pipes decreasing their capacity and increasing maintenance costs.
As part of this project, an erosion and sediment control plan is being developed by others.
CLOSURE
This report was prepared for the Limona Group to describe a stormwater management plan for the proposed West Park at Thetis development.
The services provided by Associated Engineering (B.C.) Ltd. in the preparation of this report were conducted in a manner consistent with the level of skill ordinarily exercised by members of the profession currently practicing under similar conditions. No other warranty expressed or implied is made.
Respectfully submitted, Associated Engineering (B.C.) Ltd.
APPENDIX A – DESIGN CALCULATIONS
DRAINAGE SYSTEM DESIGN AND CALCULATION SHEET
| MH/ Node From | MH/ Node To | Tributary Area (ha) | "C" | A*C | Σ(A*C) | Time of Concentration Inlet (Min) | Time of Concentration Sect. (Min) | Time of Concentration Total (Min) | Rain Fall Int. "i" 10-year (mm/hr) | Q10 (cms) | Q10 (l/s) | Sewer Design S (%) | Sewer Design D (mm) | Sewer Design L (m) | V cap (m/s) | Q cap (cms) | Q10/ Qcap % | Q100/ Qcap % |
|---|---|---|---|---|---|---|---|---|---|---|---|---|---|---|---|---|---|---|
| DMH12 | DMH11 | 0.436 | 0.73 | 0.32 | 0.32 | 8.00 | 0.58 | 8.58 | 26.42 | 0.024 | 23.50 | 0.80 | 250 | 38.00 | 1.084 | 0.053 | 44% | 64% |
| DMH11 | DMH10 | 0.146 | 0.78 | 0.11 | 0.43 | 8.58 | 0.37 | 8.95 | 25.96 | 0.031 | 31.32 | 0.80 | 250 | 24.00 | 1.084 | 0.053 | 59% | 85% |
| DMH10 | DMH09 | 0.158 | 0.53 | 0.08 | 0.52 | 8.95 | 0.49 | 9.45 | 25.39 | 0.036 | 36.48 | 0.80 | 250 | 32.00 | 1.084 | 0.053 | 69% | 99% |
| DMH09 | DMH08 | 0.344 | 0.62 | 0.21 | 0.73 | 9.45 | 0.64 | 10.09 | 24.70 | 0.050 | 50.04 | 0.80 | 300 | 47.00 | 1.224 | 0.086 | 58% | 84% |
| DMH08 | DMH07 | 0.111 | 0.85 | 0.09 | 0.82 | 10.09 | 0.19 | 10.28 | 24.50 | 0.056 | 56.11 | 5.80 | 300 | 38.00 | 3.295 | 0.233 | 24% | 35% |
| DMH07 | DMH06 | 0.142 | 0.76 | 0.11 | 0.93 | 10.28 | 0.13 | 10.40 | 24.38 | 0.063 | 63.12 | 5.80 | 300 | 25.00 | 3.295 | 0.233 | 27% | 39% |
| DMH06 | DMH05 | 0.163 | 0.63 | 0.10 | 1.03 | 10.40 | 0.18 | 10.58 | 24.20 | 0.070 | 69.62 | 8.90 | 300 | 44.00 | 4.081 | 0.288 | 24% | 35% |
| DMH05 | DMH04A | 0.455 | 0.59 | 0.27 | 1.30 | 10.58 | 0.26 | 10.85 | 23.96 | 0.087 | 86.84 | 12.00 | 300 | 75.00 | 4.739 | 0.335 | 26% | 37% |
| DMH04A | DMH4 | 0.189 | 0.68 | 0.13 | 1.43 | 10.85 | 0.16 | 11.01 | 23.81 | 0.095 | 94.79 | 12.00 | 300 | 46.00 | 4.739 | 0.335 | 28% | 41% |
| DMH4 | DMH3 (STC) | 0.080 | 0.00 | 0.00 | 1.43 | 11.01 | 0.51 | 11.52 | 23.36 | 0.093 | 93.03 | 0.91 | 375 | 46.00 | 1.514 | 0.167 | 56% | 80% |
| DMH3 (STC) | DMH02 | 0.000 | 0.00 | 0.00 | 1.43 | 11.52 | 0.03 | 11.55 | 23.34 | 0.093 | 92.92 | 10.81 | 375 | 10.00 | 5.219 | 0.576 | 16% | 23% |
| DMH02 | DMH01 (FC) | 0.000 | 0.00 | 0.00 | 1.43 | 11.55 | 0.06 | 11.61 | 23.28 | 0.093 | 92.71 | 2.80 | 375 | 10.00 | 2.656 | 0.293 | 32% | 46% |
| DMH13 | DMH04A | 0.370 | 0.64 | 0.24 | 0.24 | 8.00 | 0.23 | 8.23 | 26.89 | 0.018 | 17.82 | 3.61 | 250 | 32.00 | 2.302 | 0.113 | 16% | 23% |
| CB1 | DMH05 | 0.100 | 0.20 | 0.02 | 0.02 | 5.00 | 0.19 | 5.19 | 32.64 | 0.002 | 1.81 | 5.00 | 200 | 26.00 | 2.334 | 0.073 | 2% | 4% |
Proposed Runoff Coefficient and Imperviousness
| Subcatchment flows to | Hardscape/Roof | Landscape | Natural | Rock | Total Area | Average RC |
|---|---|---|---|---|---|---|
| DMH13 | 2192 | 1508 | 3700 | 0.64 | ||
| DMH12 | 3194 | 490 | 671 | 4355 | 0.73 | |
| DMH11 | 1130 | 334 | 1464 | 0.78 | ||
| DMH10 | 585 | 892 | 100 | 1577 | 0.53 | |
| DMH09 | 1965 | 630 | 791 | 3436 | 0.62 | |
| DMH08 | 968 | 144 | 1112 | 0.85 | ||
| DMH07 | 1057 | 365 | 1422 | 0.76 | ||
| DMH06 | 942 | 692 | 1634 | 0.63 | ||
| DMH05 | 2378 | 2169 | 4547 | 0.59 | ||
| DMH04A | 1206 | 684 | 1890 | 0.68 | ||
| DMH04 | 702 | 100 | 802 | 0.86 | ||
| DMH03 (STC) | 0 | |||||
| DMH02 | 0 | |||||
| DMH01 (FC) | 0 |
| Surface Type | Runoff Coefficient | Source |
|---|---|---|
| Hardscape/Roof | 0.95 | |
| Landscape | 0.2 | MMCD Design Guidelines - Parks/Grassland |
| Natural | 0.1 | MMCD Design Guidelines - Woodlands |
| Rock | 0.95 |
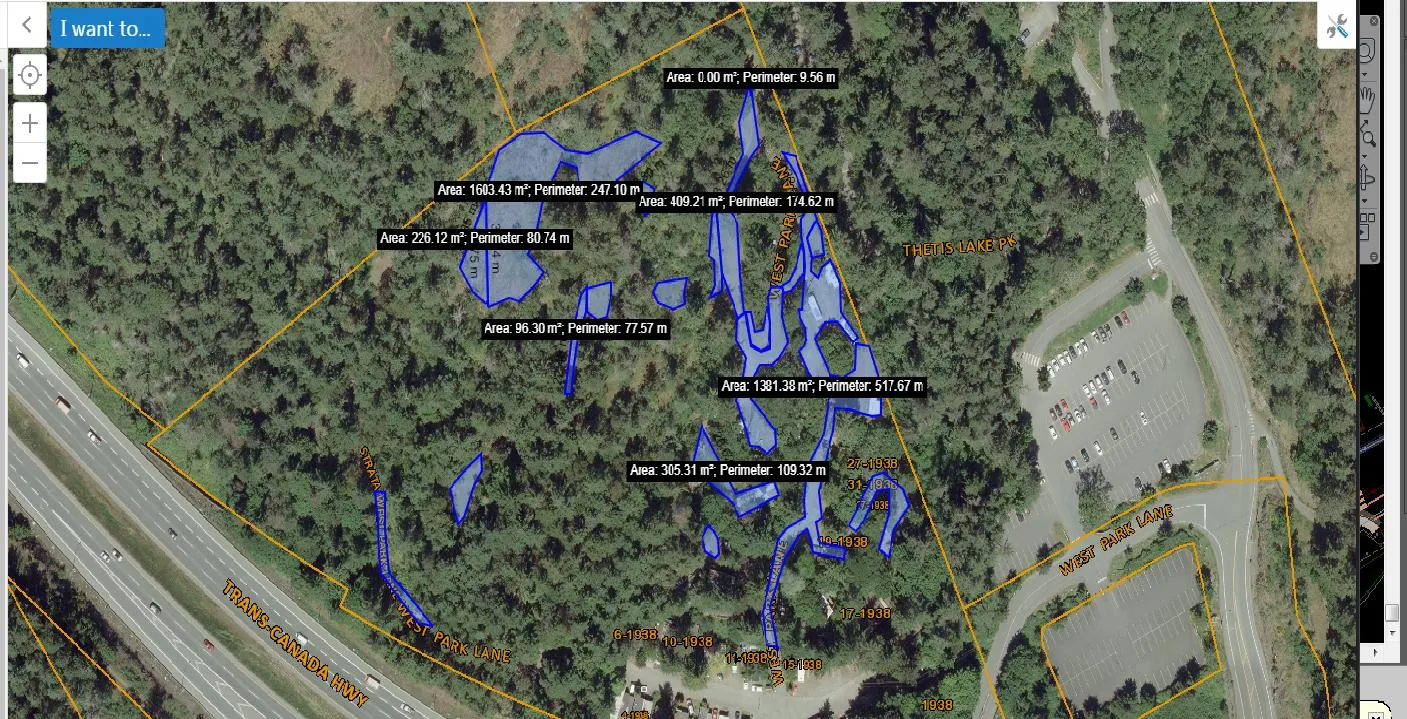
Total impervious area estimated from orthophoto is 3700 m2. Not all labels are shown on this figure. The approximate split for impervious areas is: 1300 m2 exposed rock (5.2%) 2400 m2 asphalt/roof (9.7%) 24850 m2 total
CATCHMENT AREAS 802 m² TO DMH 4 1890 m² TO DMH 4A 4547 m² TO DMH 5 1634 m² TO DMH 6 1422 m² TO DMH 7 1112 m² TO DMH 8 3436 m² TO DMH 9 1577 m² TO DMH 10 1464 m² TO DMH 11 4355 m² TO DMH 12 3700 m² TO DMH 13
SURFACE TYPE 4 HARD SURFACE 702 m² LANDSCAPED 100 m² 4a HARD SURFACE 1206 m² LANDSCAPED 684 m² 5 HARD SURFACE 2378 m² LANDSCAPED 2169 m² 6 HARD SURFACE 942 m² LANDSCAPED 692 m² 7 HARD SURFACE 1057 m² LANDSCAPED 365 m² 8 HARD SURFACE 968 m² LANDSCAPED 144 m² 9 HARD SURFACE 1965 m² LANDSCAPED 630 m² NATURAL VEGETATION 791 m² EXPOSED ROCK 50 m² 10 HARD SURFACE 585 m² LANDSCAPED 892 m² EXPOSED ROCK 100 m² 11 HARD SURFACE 1130 m² LANDSCAPED 334 m² 12 HARD SURFACE 3194 m² LANDSCAPED 490 m² NATURAL VEGETATION 671 m² 13 HARD SURFACE 2192 m² LANDSCAPED 1508 m²
Document Images
(12)