Attachment 9. Water, Storm and Sanitary Servicing Review - J.E. Anderson & Associates
Engineering review of the infrastructure capacity for the proposed development.
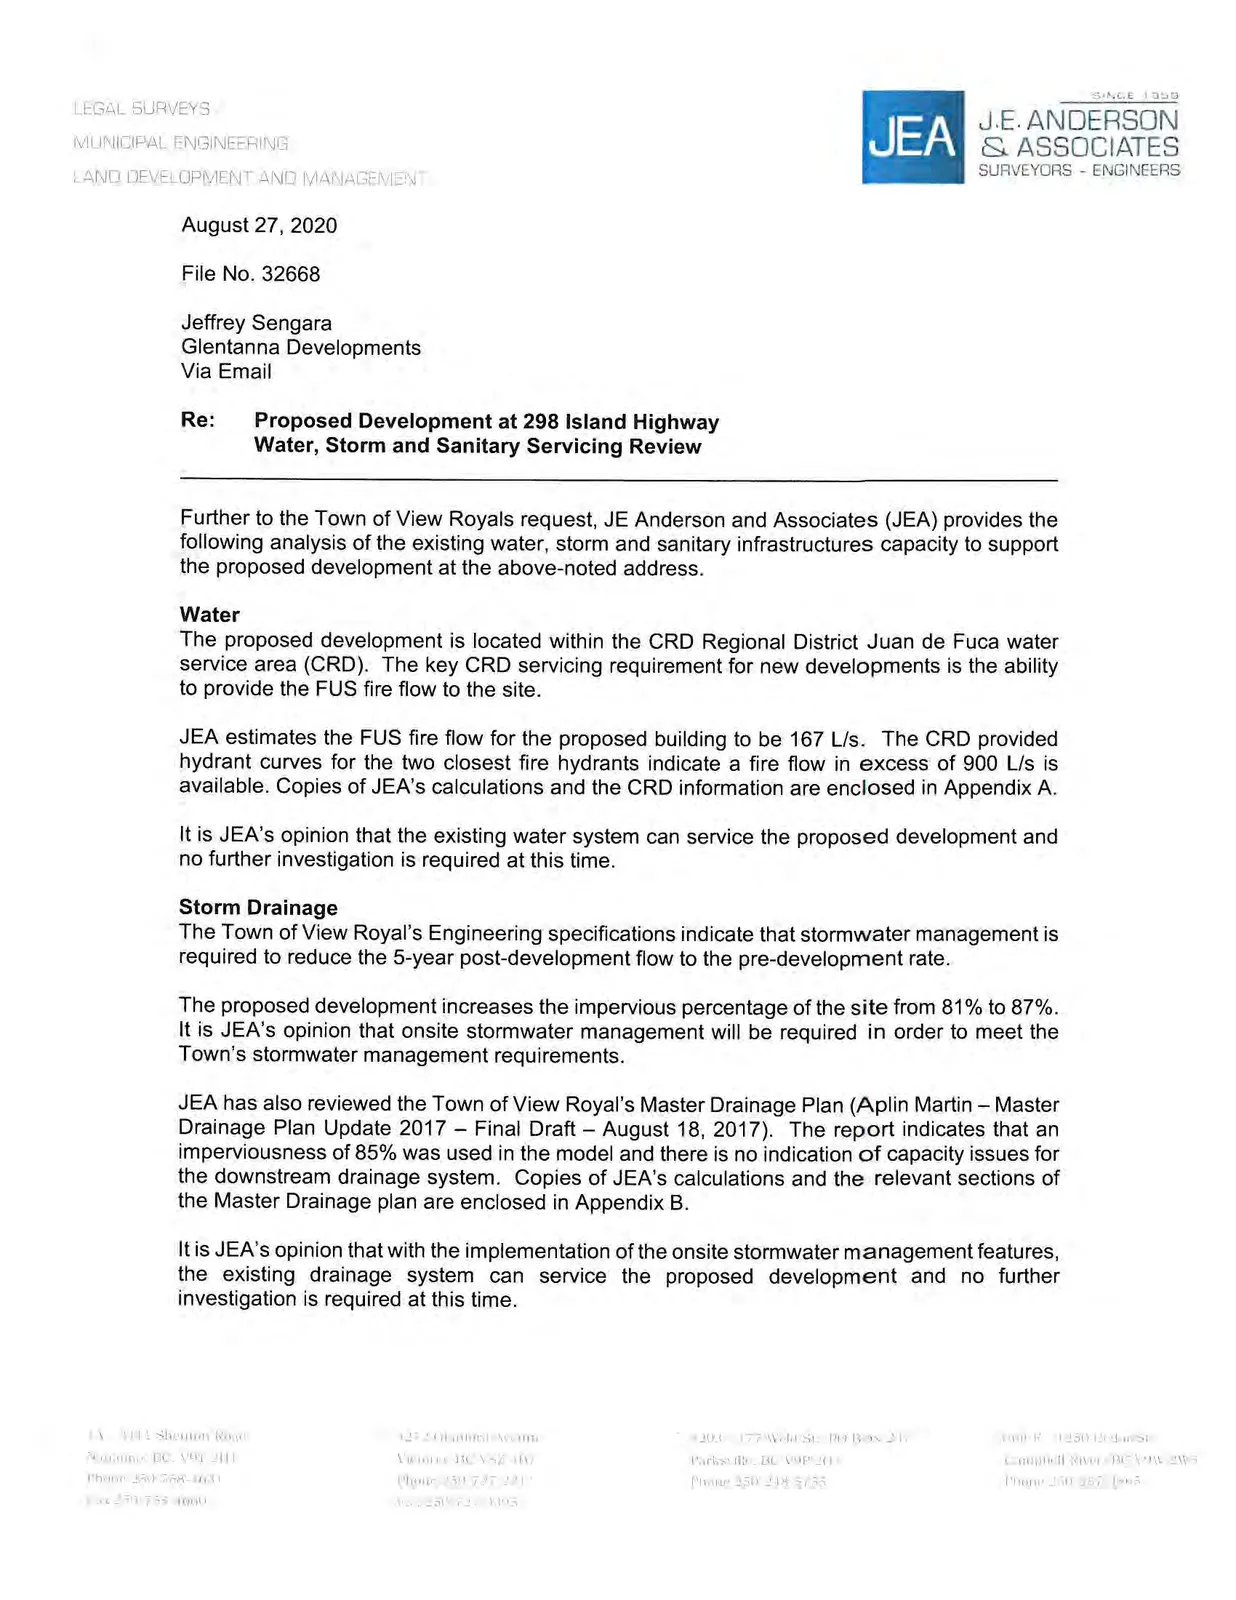
August 27, 2020
File No. 32668
Jeffrey Sengara Glentanna Developments Via Email
Re: Proposed Development at 298 Island Highway Water, Storm and Sanitary Servicing Review
Further to the Town of View Royals request, JE Anderson and Associates (JEA) provides the following analysis of the existing water, storm and sanitary infrastructures capacity to support the proposed development at the above-noted address.
Water
The proposed development is located within the CRD Regional District Juan de Fuca water service area (CRD). The key CRD servicing requirement for new developments is the ability to provide the FUS fire flow to the site.
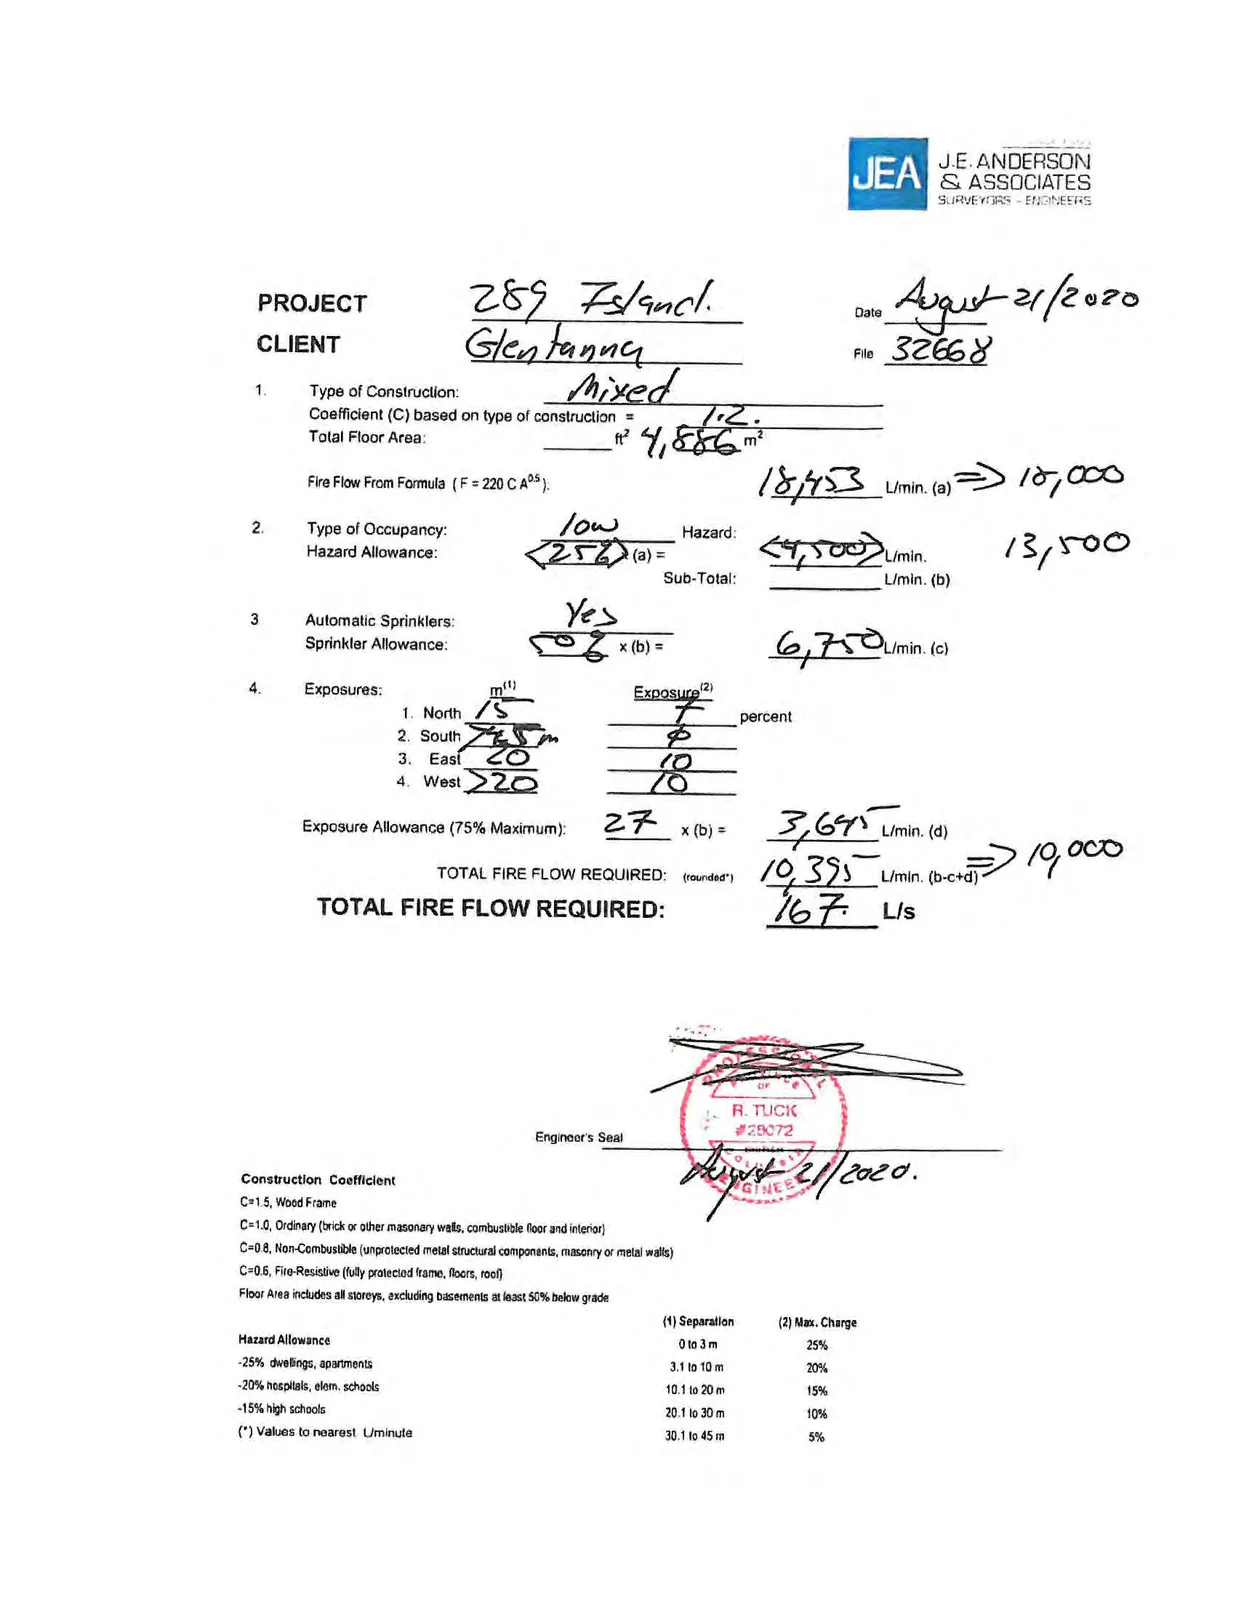
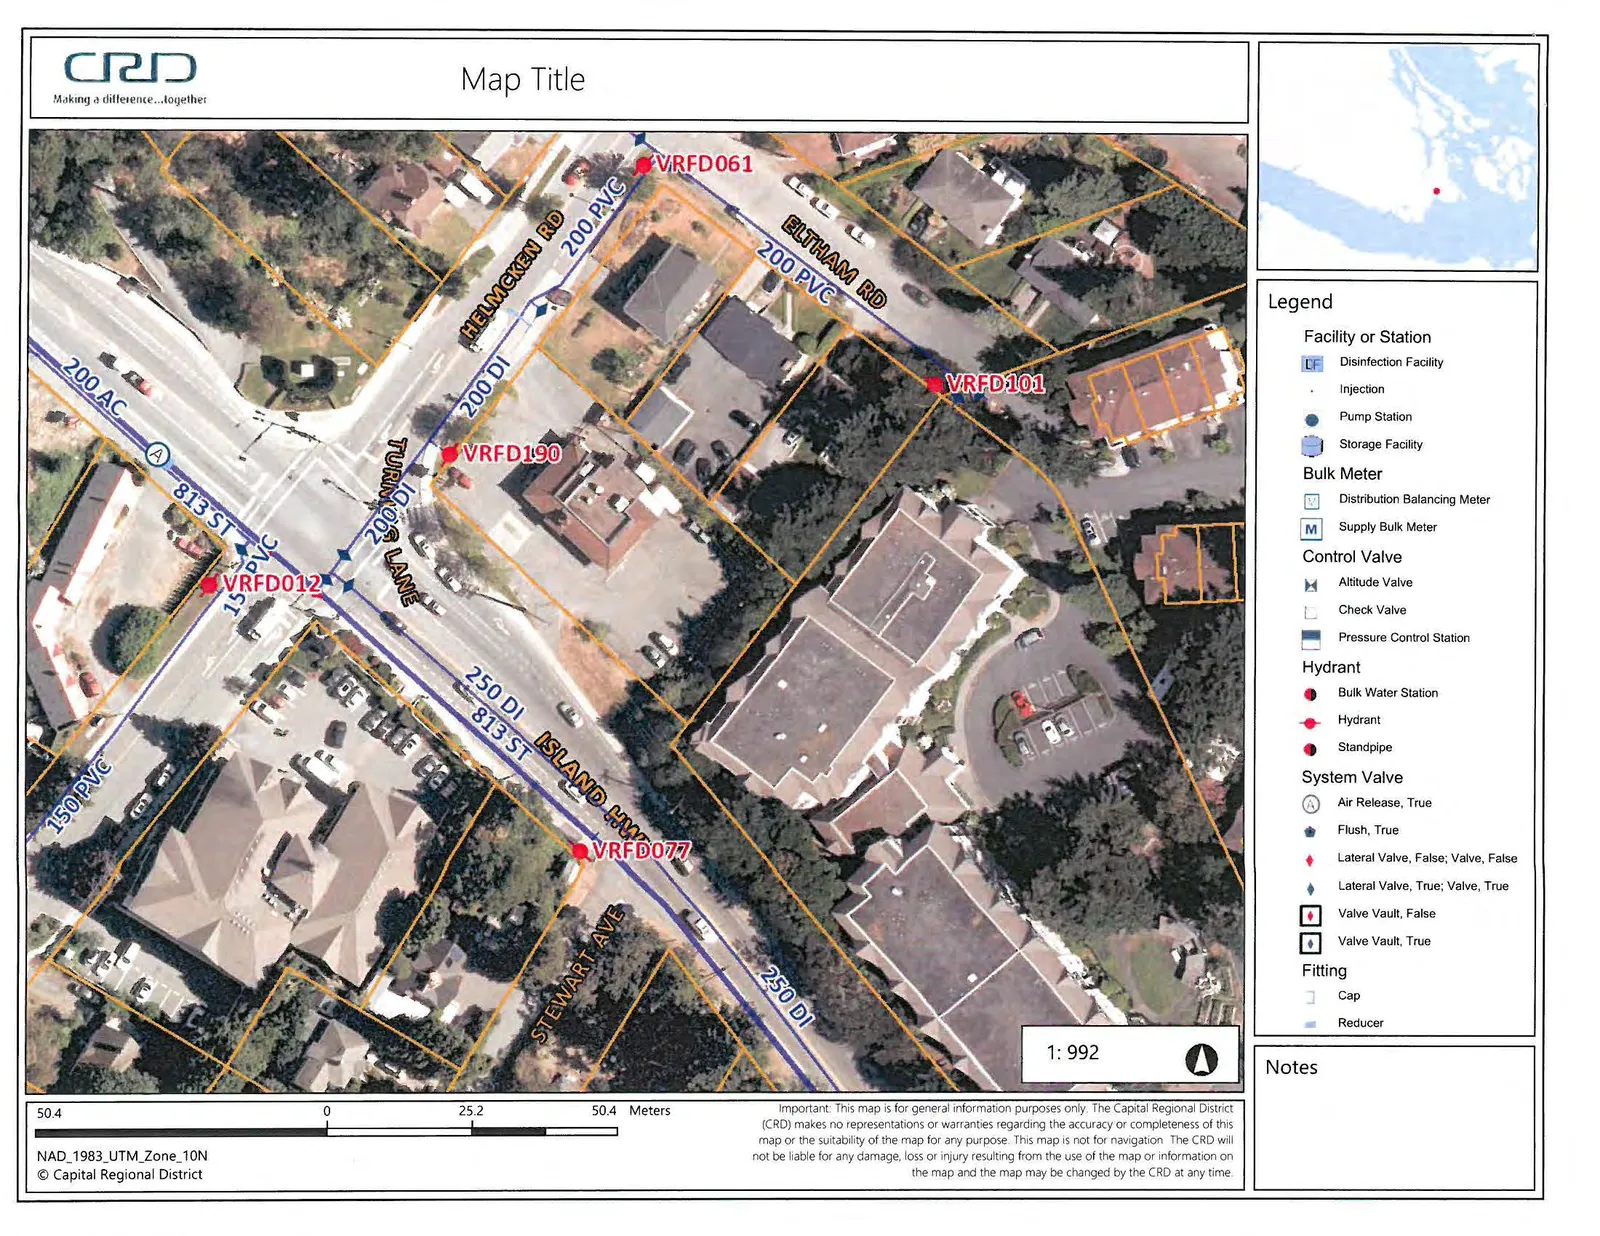
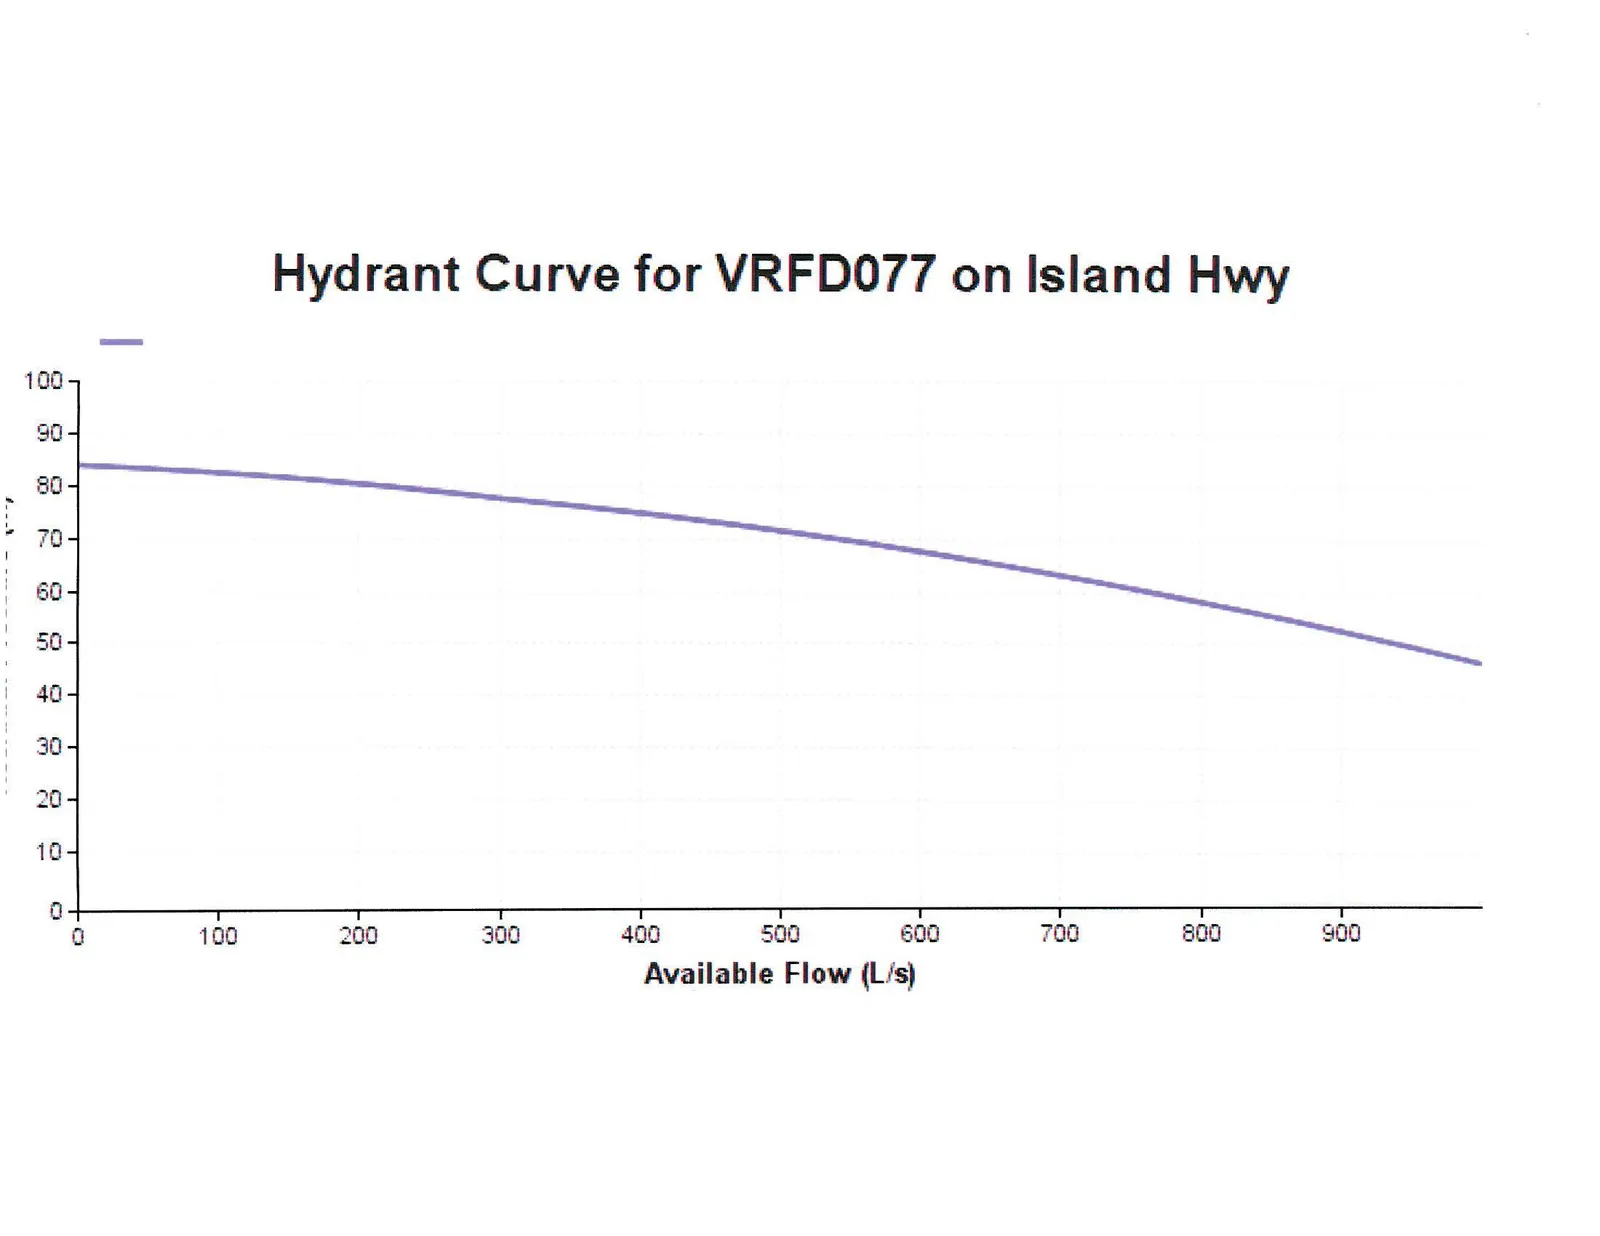
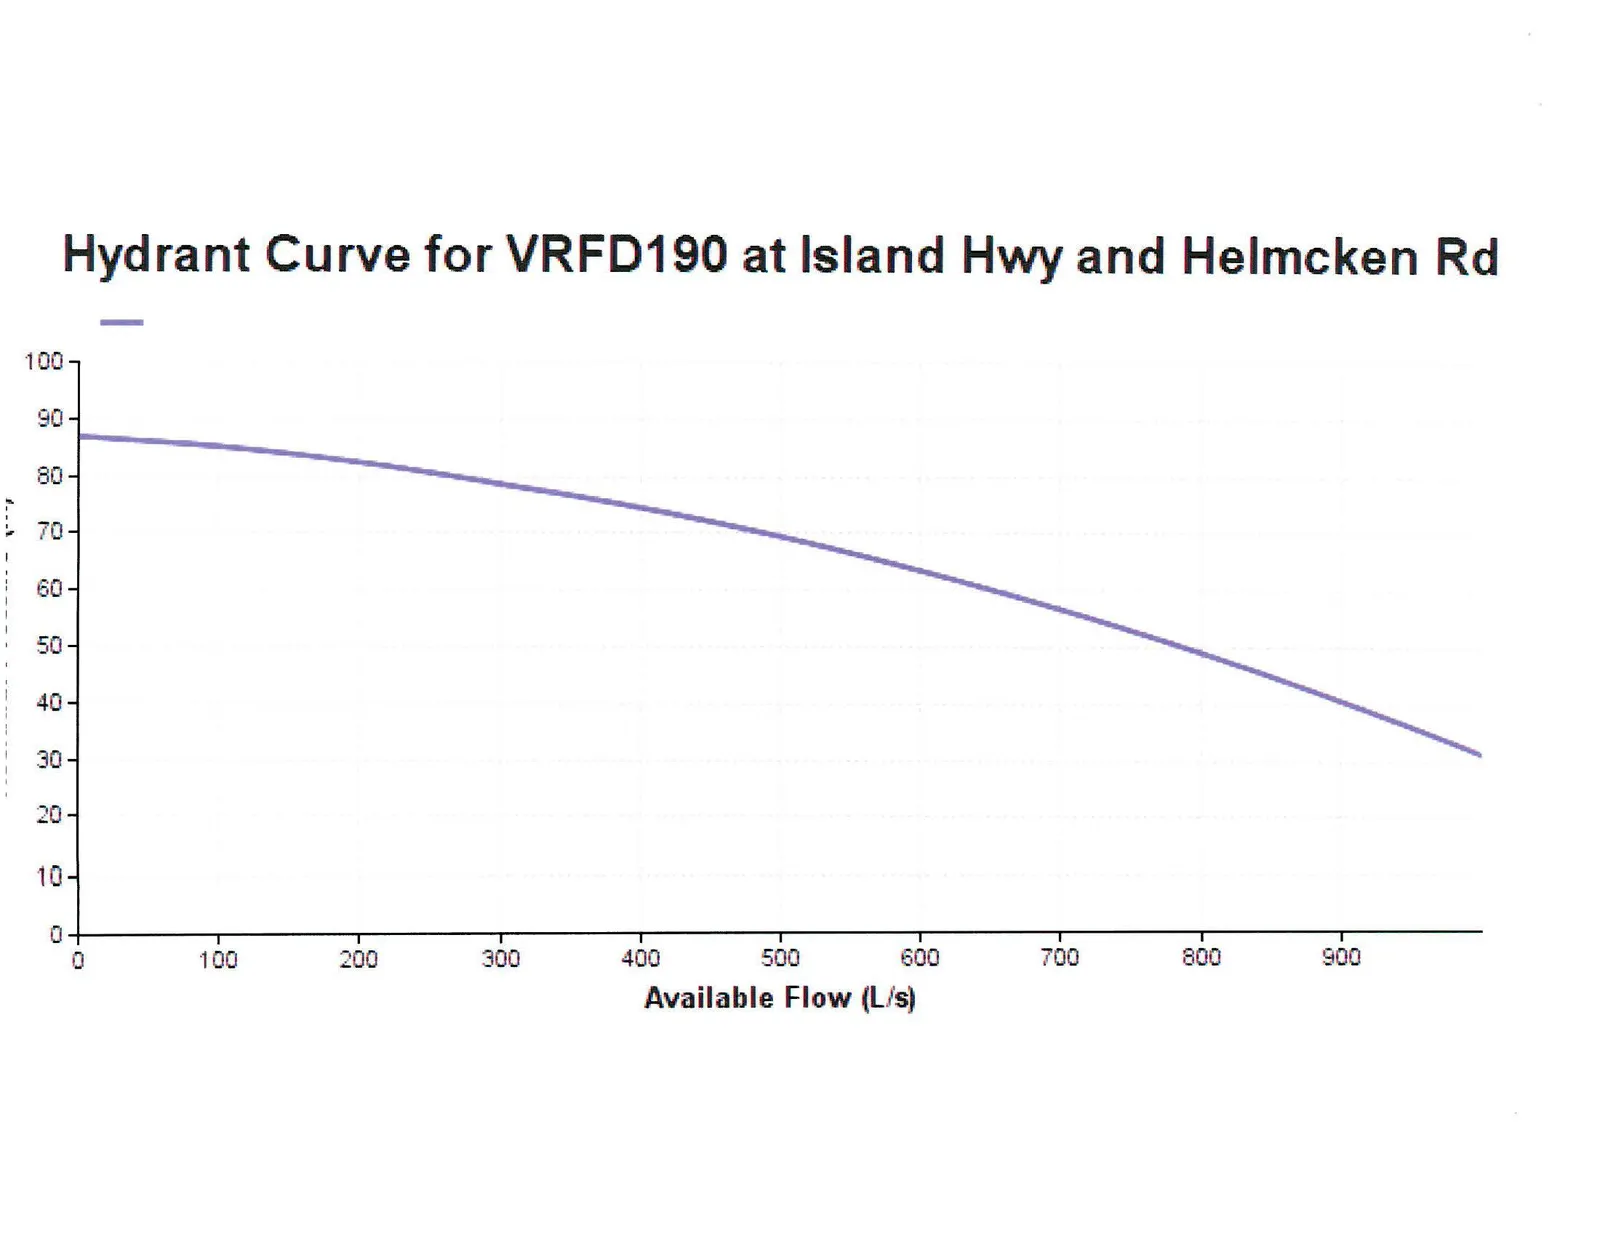
JEA estimates the FUS fire flow for the proposed building to be 167 L/s. The CRD provided hydrant curves for the two closest fire hydrants indicate a fire flow in excess of 900 L/s is available. Copies of JEA's calculations and the CRD information are enclosed in Appendix A.
It is JEA's opinion that the existing water system can service the proposed development and no further investigation is required at this time.
Storm Drainage
The Town of View Royal's Engineering specifications indicate that stormwater management is required to reduce the 5-year post-development flow to the pre-development rate.
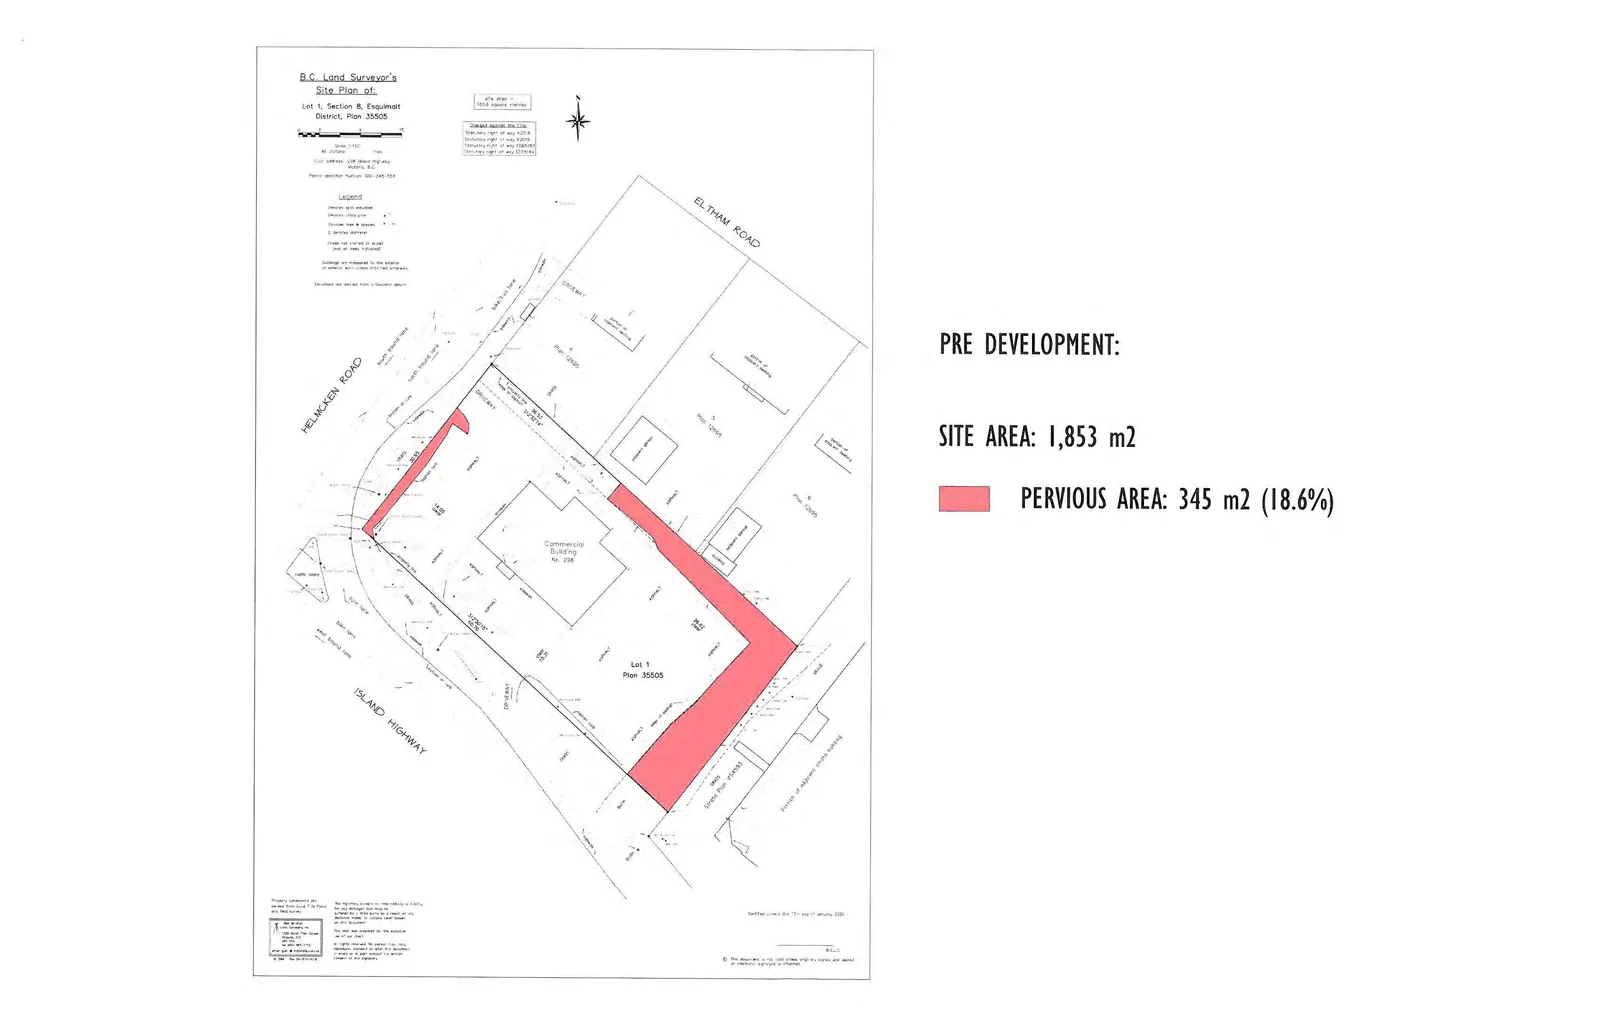
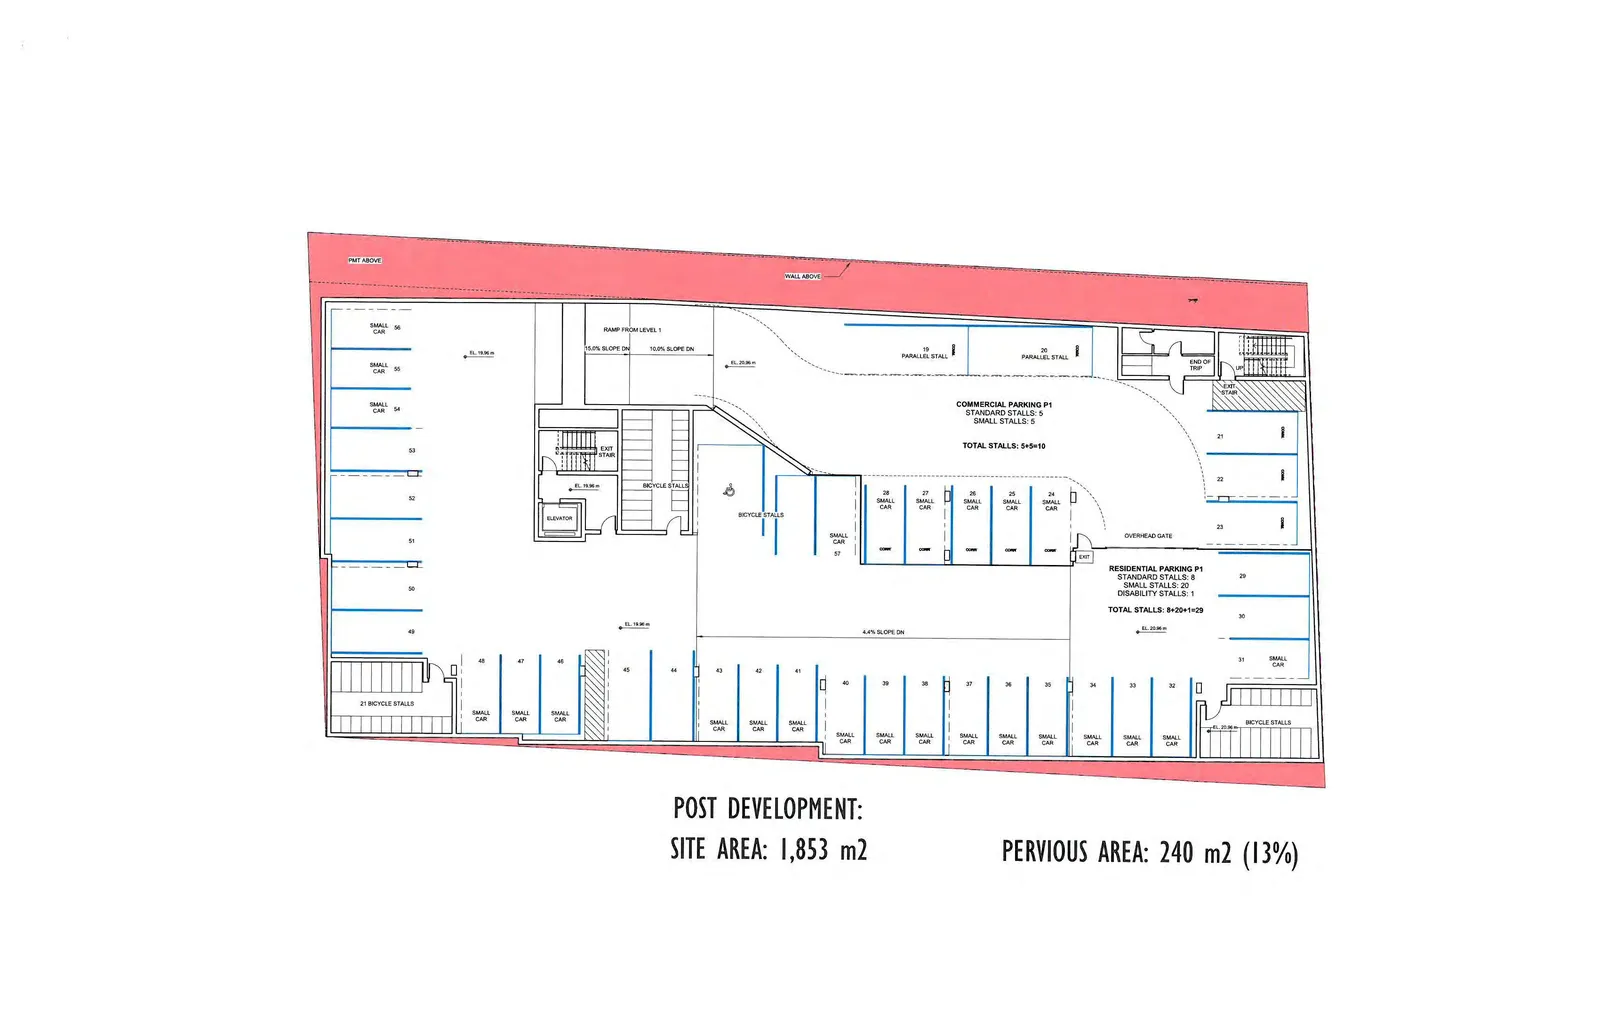
The proposed development increases the impervious percentage of the site from 81% to 87%. It is JEA's opinion that onsite stormwater management will be required in order to meet the Town's stormwater management requirements.
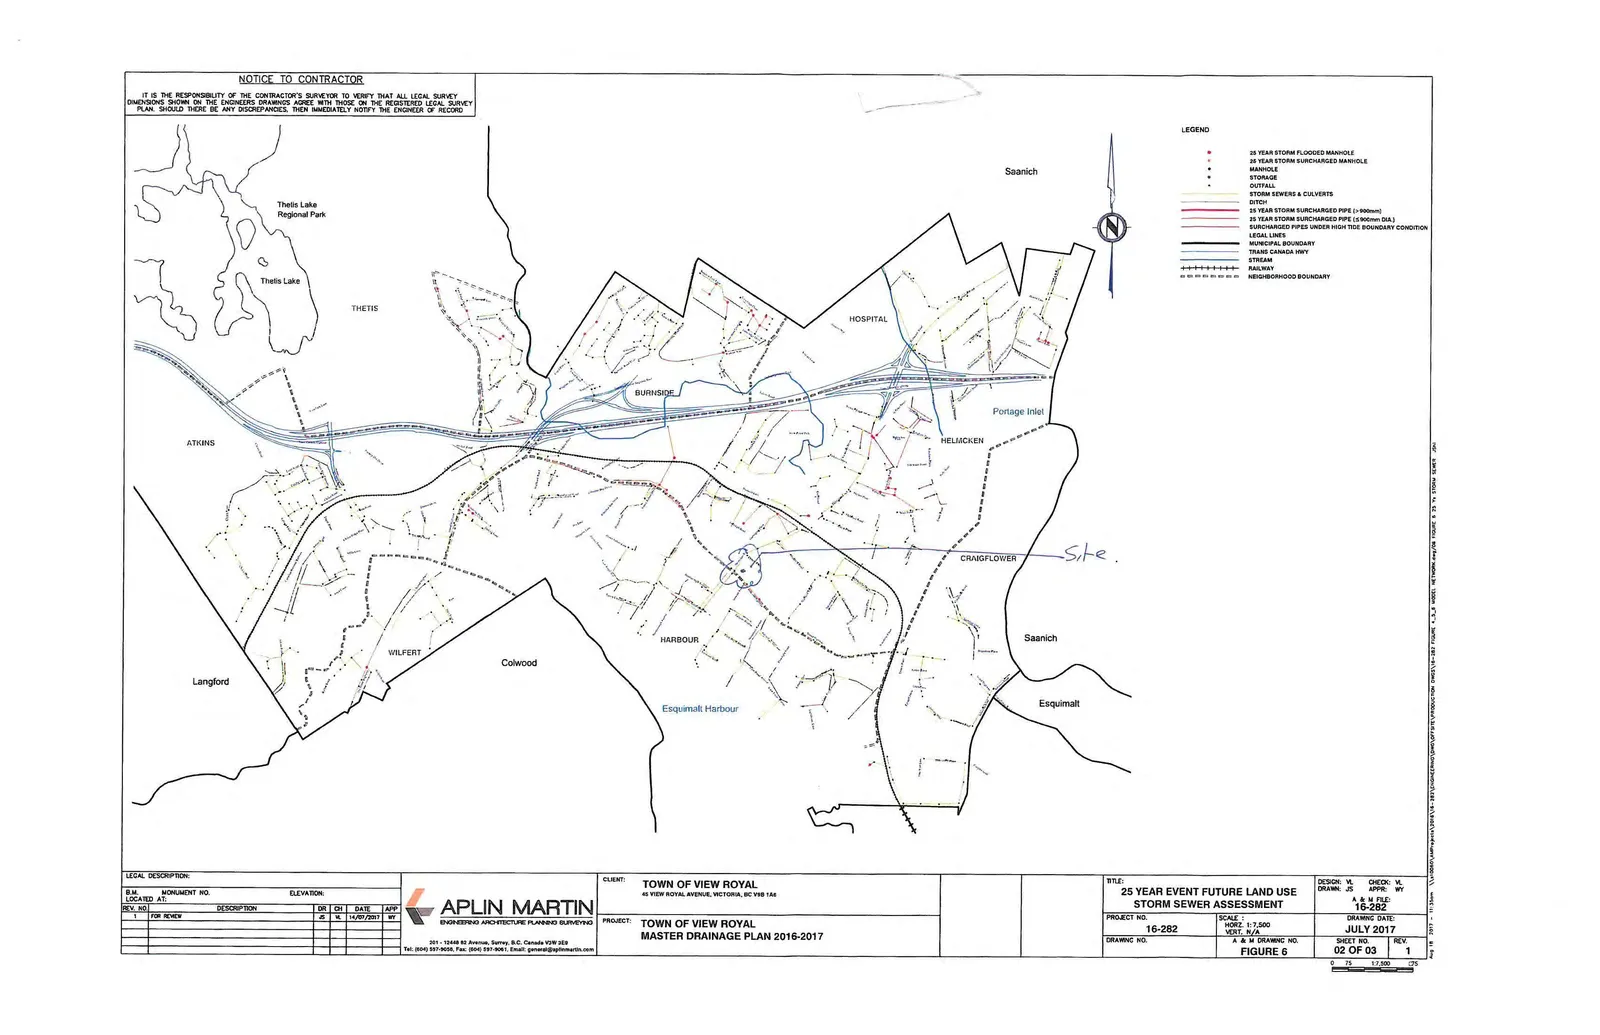
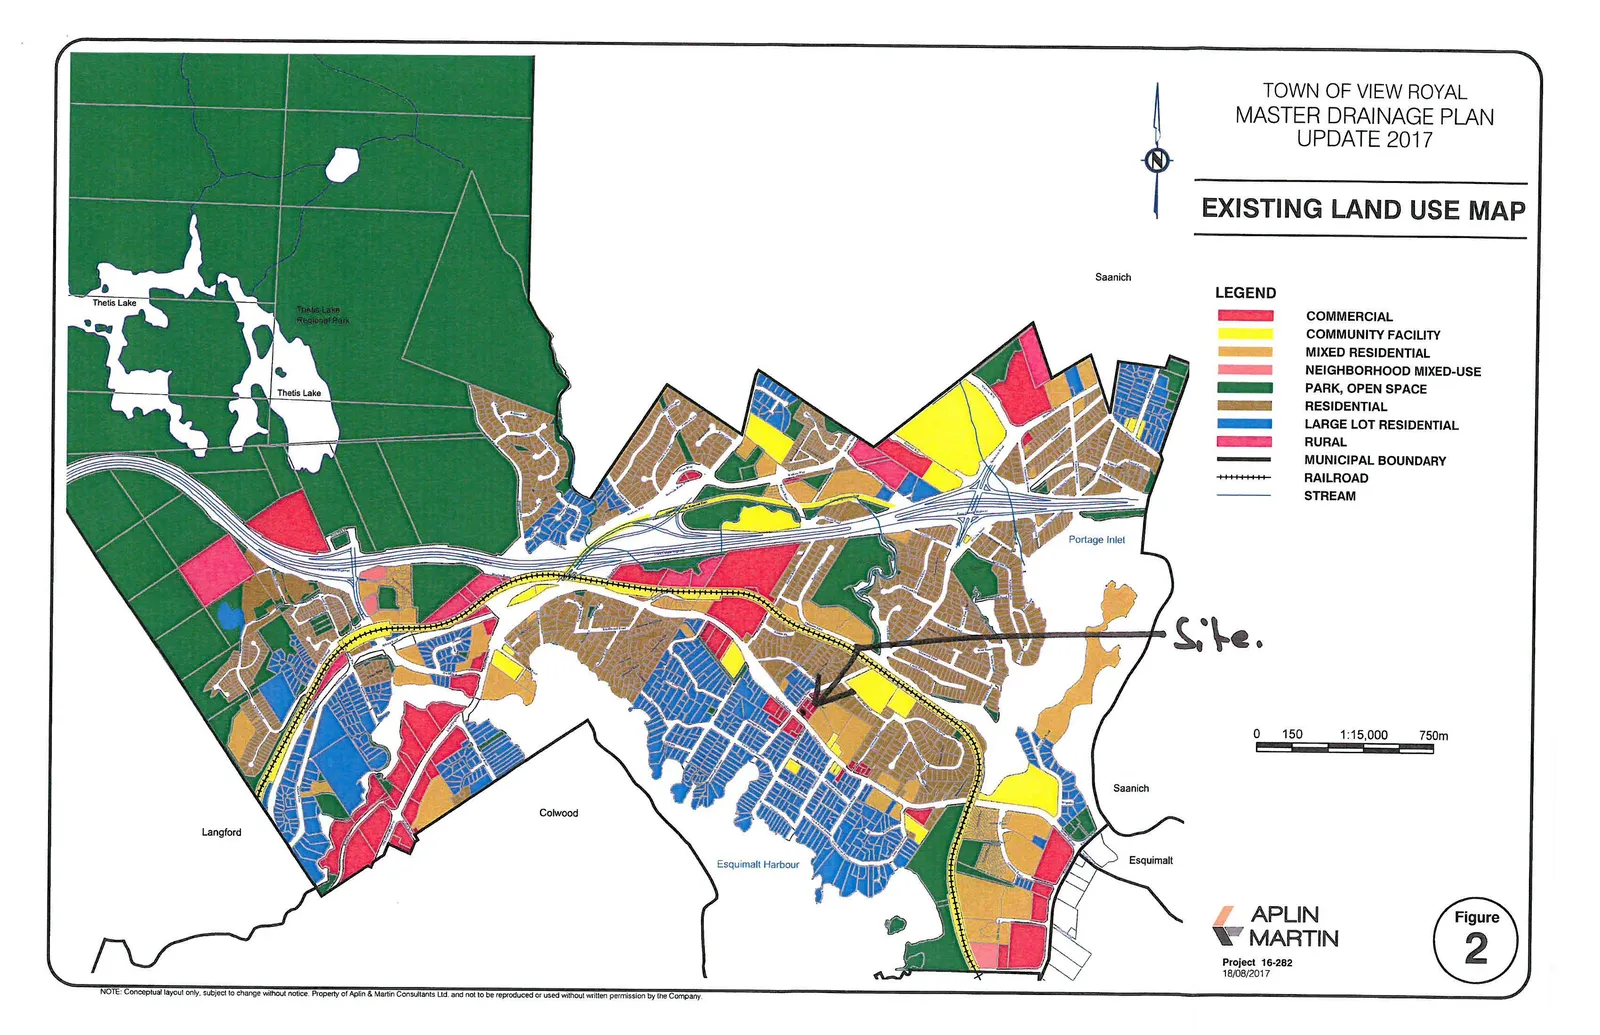
JEA has also reviewed the Town of View Royal's Master Drainage Plan (Aplin Martin – Master Drainage Plan Update 2017 – Final Draft – August 18, 2017). The report indicates that an imperviousness of 85% was used in the model and there is no indication of capacity issues for the downstream drainage system. Copies of JEA's calculations and the relevant sections of the Master Drainage plan are enclosed in Appendix B.
It is JEA's opinion that with the implementation of the onsite stormwater management features, the existing drainage system can service the proposed development and no further investigation is required at this time.
Sanitary
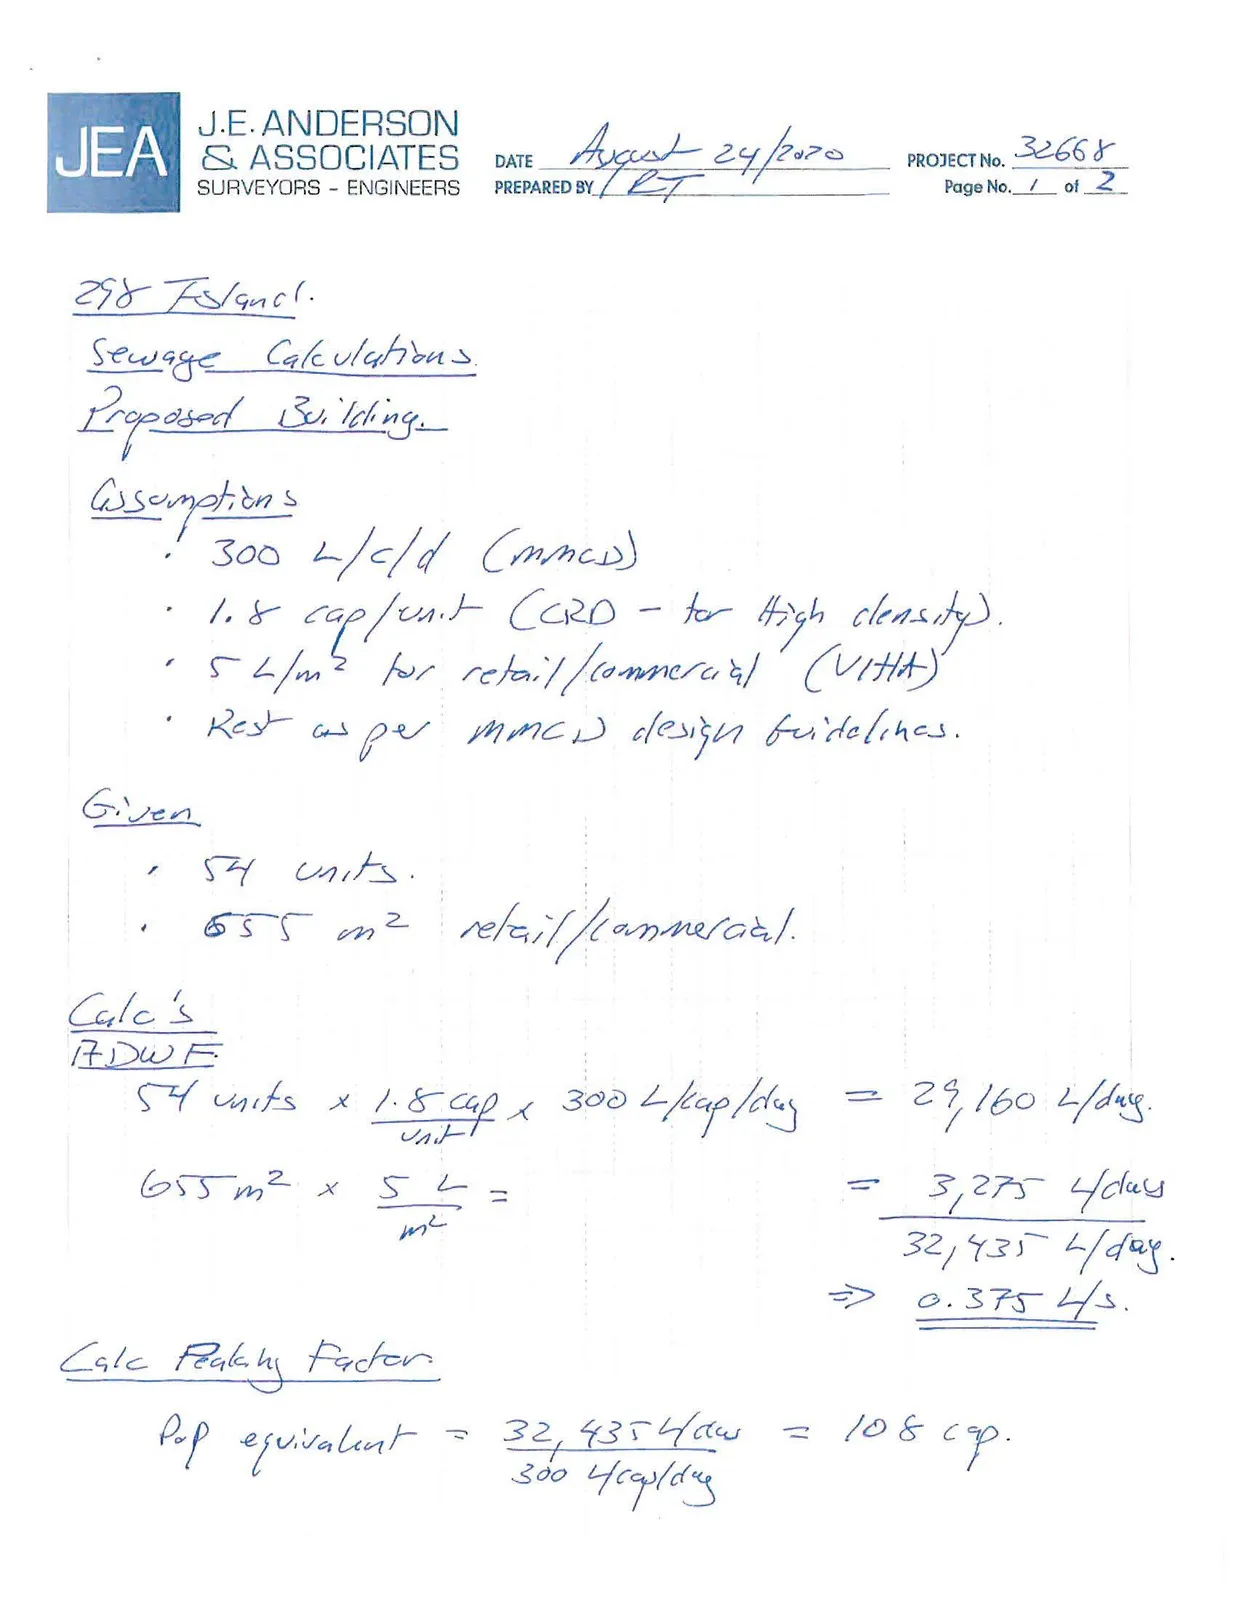
JEA has also reviewed the Town of View Royal's Sewer Master Plan (McElhanney – View Royal Sanitary Master Plan – Working Draft – December 16, 2017). The report indicates that an FSR of 1.2 - 1.5 was applied to the site. JEA cursory calculations indicate that the proposed development will increase the Peak Wet Weather Flow (PWWF) by approximately 0.7 L/s over what was likely used in the sewer model.
Reviewing the Sewer Master Plan, it appears that the downstream pipes should have adequate capacity for the additional flow as the Sewer Master Plan indicates that the downstream pipes will flow with less than 50% depth for the Future Population with a 100 year storm. With respect to the sewage pump station, the sewer master plan indicates that pumpstation there should be capacity for the increased flow under the Q100 scenario; However, there is relatively little additional pumpstation capacity under the Q100 scenario.
Please note that JEA's calculations are relatively rudimentary in relation to the Town of View Royal's sewer model. It is JEA opinion that our calculations should be on the conservative side (estimating a higher flow due to the high peaking factor for such a small site), the Town may wish to consider updating the sewer model to confirm.
It is JEA's opinion that the existing sanitary system is capable of servicing the proposed development and however some additional investigation may be required to confirm the sewage pumpstation capacity.
If you have any questions regarding this report, please feel free to contact the undersigned at your convenience.
Yours truly,
J.E. Anderson and Associates
Ross Tuck, P.Eng Principal
Appendix A
- FUS Calculations
- CRD Information
Development Data Summary
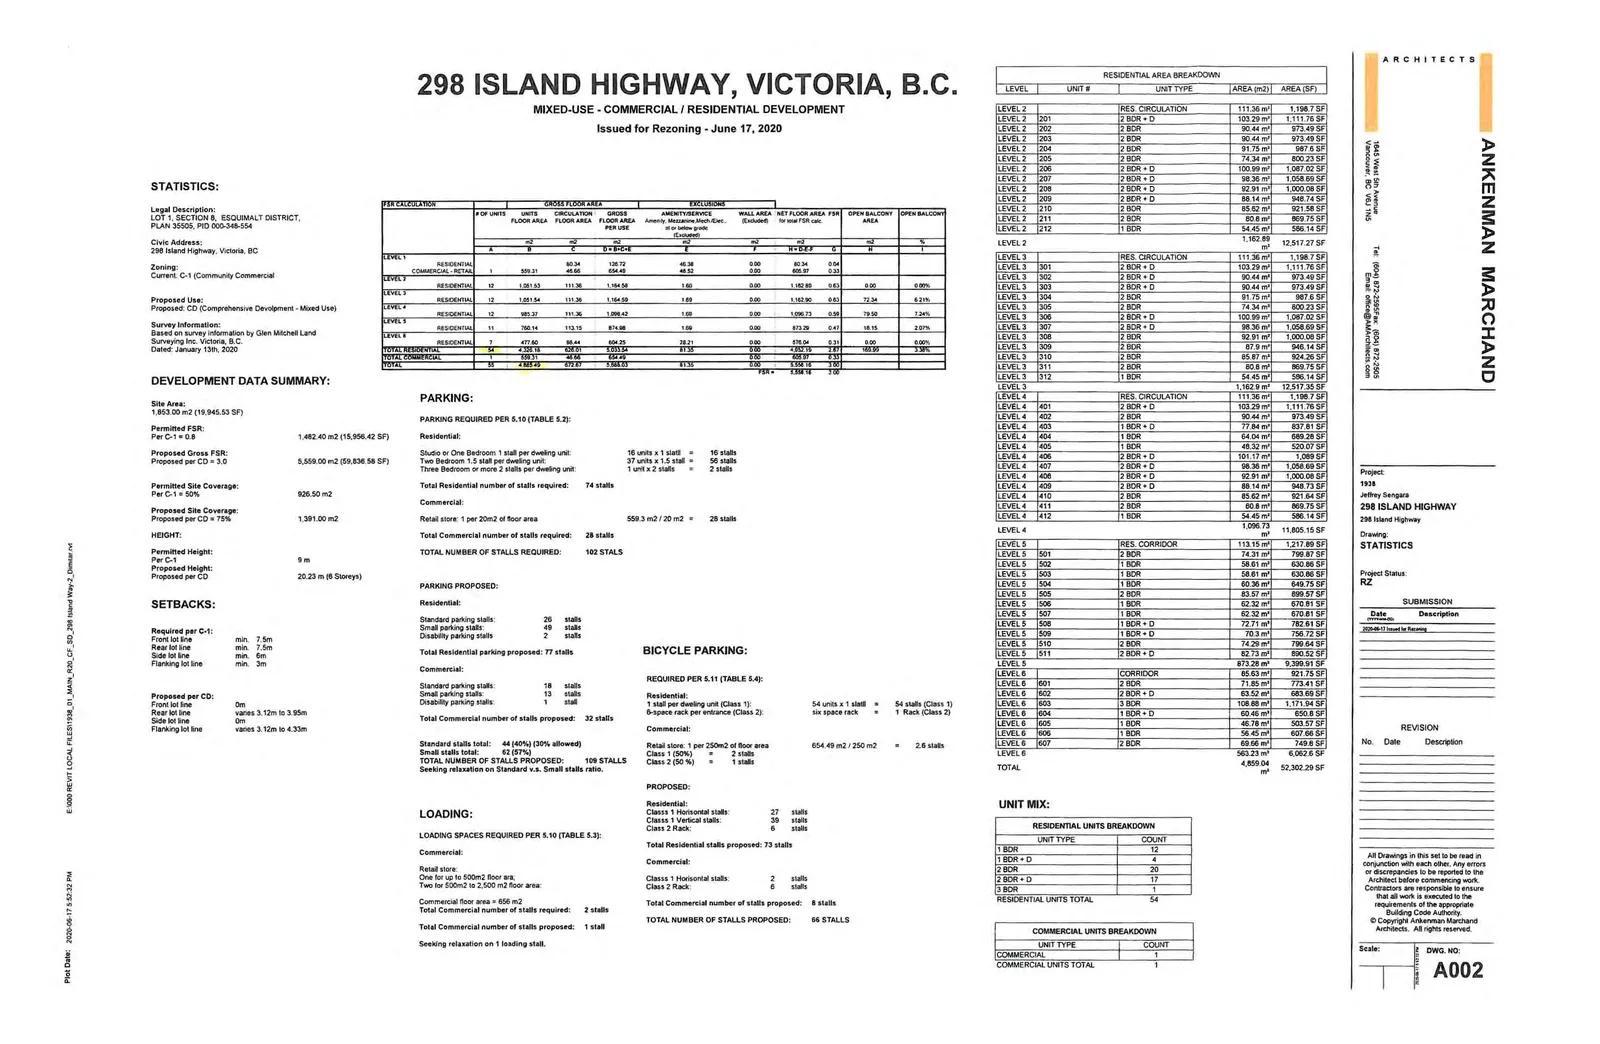
- Site Area: 1,853.00 m² (19,945.53 SF)
- Permitted FSR (Per C-1 = 0.8): 1,482.40 m² (15,956.42 SF)
- Proposed Gross FSR (per CD = 3.0): 5,559.00 m² (59,838.58 SF)
- Permitted Site Coverage (Per C-1 = 50%): 926.50 m²
- Proposed Site Coverage (per CD = 75%): 1,391.00 m²
- Permitted Height (Per C-1): 9 m
- Proposed Height (per CD): 20.23 m (8 Storeys)
Setbacks
| Setback | Required (C-1) | Proposed (CD) |
|---|---|---|
| Front lot line | min. 7.5m | 0m |
| Rear lot line | min. 7.5m | varies 3.12m to 3.95m |
| Side lot line | min. 6m | 0m |
| Flanking lot line | min. 3m | varies 3.12m to 4.33m |
Parking Summary
- Residential Parking Required: 74 stalls
- Commercial Parking Required: 28 stalls
- Total Stalls Required: 102 stalls
- Total Stalls Proposed: 109 stalls
Residential Area Breakdown
| Level | Unit # | Unit Type | Area (m²) | Area (SF) |
|---|---|---|---|---|
| LEVEL 2 | 201 | 2 BDR + D | 103.29 m² | 1,111.76 SF |
| LEVEL 2 | 202 | 2 BDR | 90.44 m² | 973.49 SF |
| LEVEL 2 | 203 | 2 BDR | 90.44 m² | 973.49 SF |
| LEVEL 2 | 204 | 2 BDR | 91.75 m² | 987.6 SF |
| LEVEL 2 | 205 | 2 BDR | 74.34 m² | 800.23 SF |
| LEVEL 2 | 206 | 2 BDR + D | 100.99 m² | 1,087.02 SF |
| LEVEL 2 | 207 | 2 BDR + D | 98.36 m² | 1,058.69 SF |
| LEVEL 2 | 208 | 2 BDR + D | 92.91 m² | 1,000.08 SF |
| LEVEL 2 | 209 | 2 BDR + D | 88.14 m² | 948.74 SF |
| LEVEL 2 | 210 | 2 BDR | 85.62 m² | 921.58 SF |
| LEVEL 2 | 211 | 2 BDR | 80.8 m² | 869.75 SF |
| LEVEL 2 | 212 | 1 BDR | 54.45 m² | 586.14 SF |
| TOTAL LEVEL 2 | 1,162.89 m² | 12,517.27 SF |
(Levels 3-6 follow similar breakdowns as shown on architect sheet)
Unit Mix
| Unit Type | Count |
|---|---|
| 1 BDR | 12 |
| 1 BDR + D | 4 |
| 2 BDR | 20 |
| 2 BDR + D | 17 |
| 3 BDR | 1 |
| Total Residential | 54 |
Appendix B
- Relevant Master Storm Drain Information
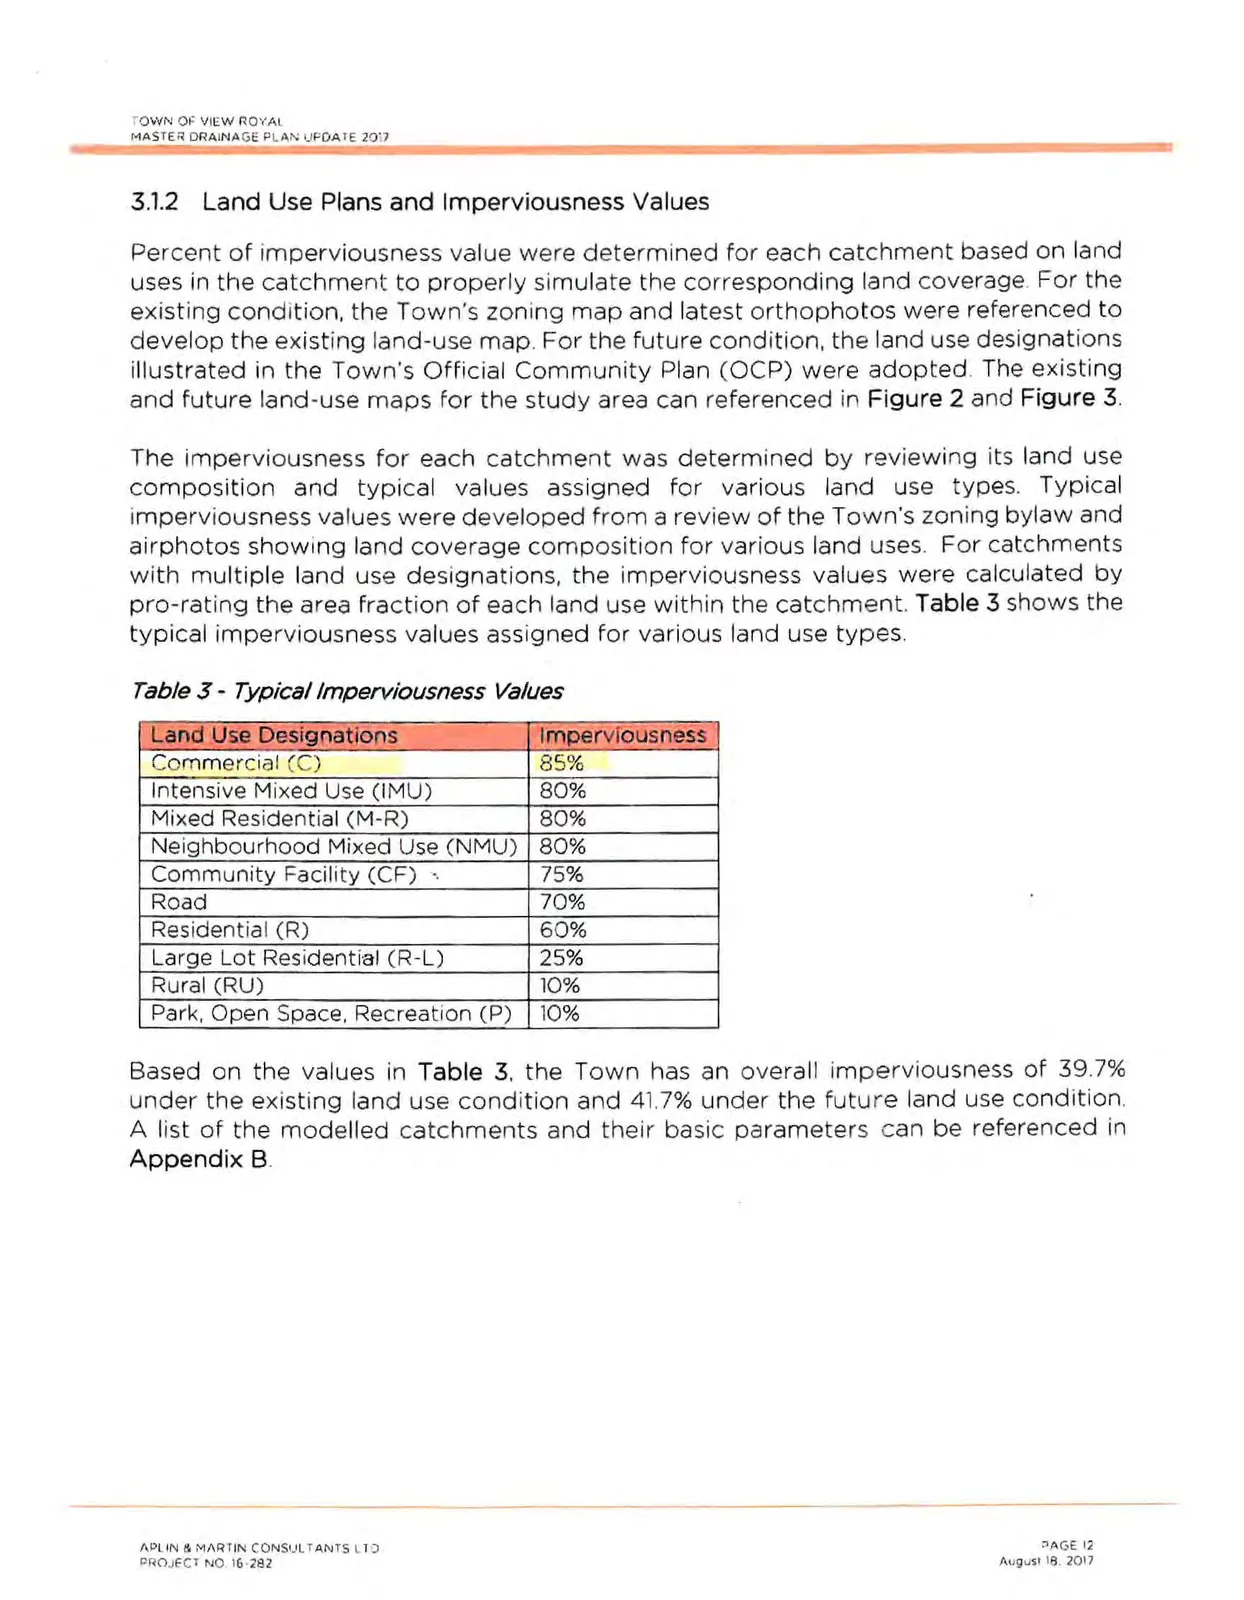
3.1.2 Land Use Plans and Imperviousness Values
Table 3 shows the typical imperviousness values assigned for various land use types.
Table 3 - Typical Imperviousness Values
| Land Use Designations | Imperviousness |
|---|---|
| Commercial (C) | 85% |
| Intensive Mixed Use (IMU) | 80% |
| Mixed Residential (M-R) | 80% |
| Neighbourhood Mixed Use (NMU) | 80% |
| Community Facility (CF) | 75% |
| Road | 70% |
| Residential (R) | 60% |
| Large Lot Residential (R-L) | 25% |
| Rural (RU) | 10% |
| Park, Open Space, Recreation (P) | 10% |
Appendix C
- Sanitary Calculations
- Relevant Sewer Master Plan Information
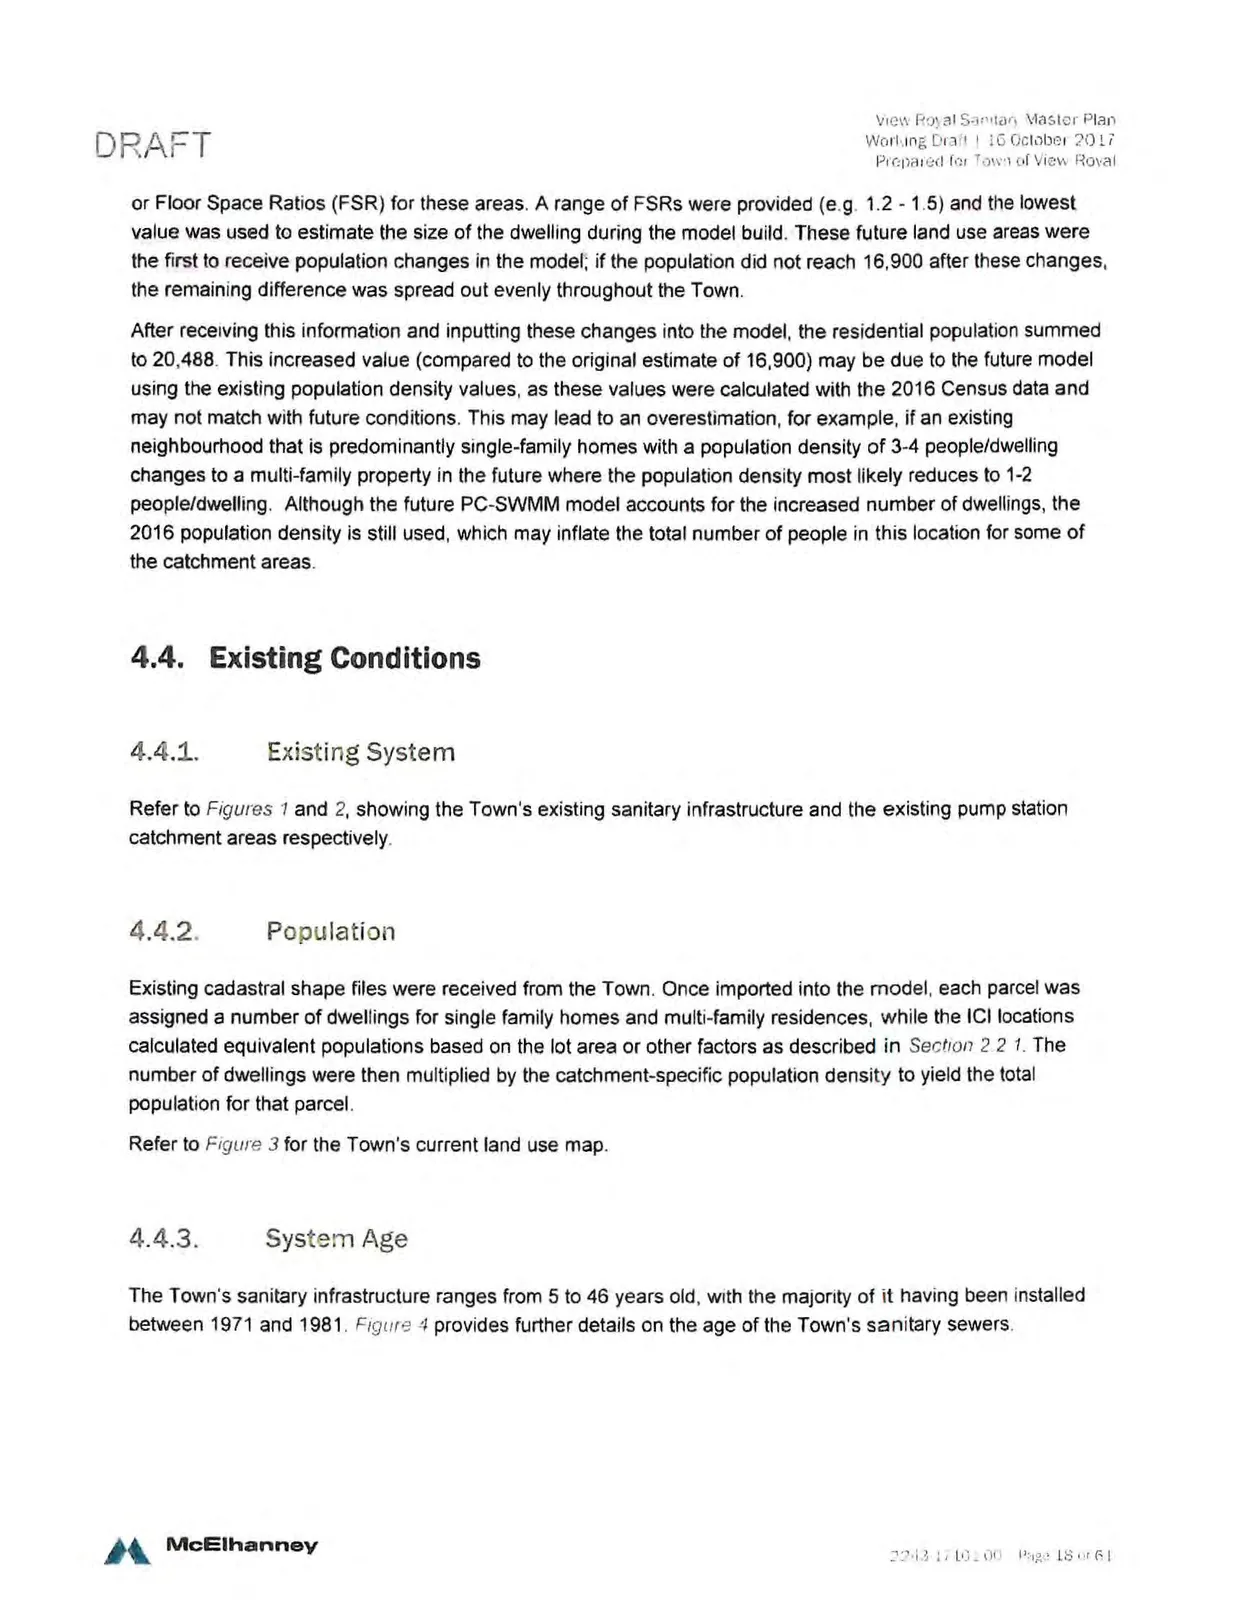
4.4. Existing Conditions
4.4.1. Existing System
Refer to Figures 1 and 2, showing the Town's existing sanitary infrastructure and the existing pump station catchment areas respectively.
4.4.2. Population
Existing cadastral shape files were received from the Town. Once imported into the model, each parcel was assigned a number of dwellings for single family homes and multi-family residences, while the ICI locations calculated equivalent populations based on the lot area or other factors as described in Section 2.2.1. The number of dwellings were then multiplied by the catchment-specific population density to yield the total population for that parcel.
Refer to Figure 3 for the Town's current land use map.
4.4.3. System Age
The Town's sanitary infrastructure ranges from 5 to 46 years old, with the majority of it having been installed between 1971 and 1981. Figure 4 provides further details on the age of the Town's sanitary sewers.
Document Images
(7)